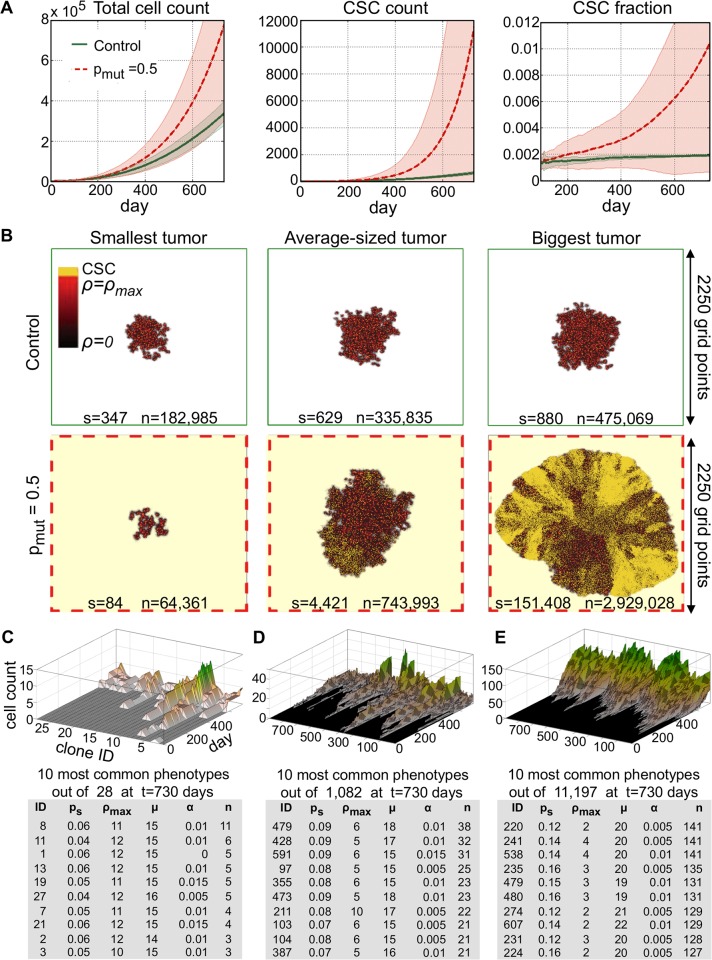
Fig 1. A) Tumor growth curves, cancer stem cell (CSC) number and fraction as a function of time for tumors without evolution (control, green solid curve) and with evolution probability of 50% (pmut = 0.5, red dashed curve).
B) Simulation snapshots of the smallest, an average-sized and biggest tumor in the control and evolved tumor at t = 730 days. s: number of cancer stem cells; n: number of total cancer cells. C) Temporal evolution of the 28 phenotypes in the smallest evolved tumor and trait details of the 10 most common phenotypes. D) Temporal evolution of the 1000 most common phenotypes at t = 730 days in an evolved averaged-sized tumor and trait details of the 10 most common phenotypes. E) Temporal evolution of the 1000 most common phenotypes at t = 730 days in the biggest evolved tumor and trait details of the 10 most common phenotypes.

