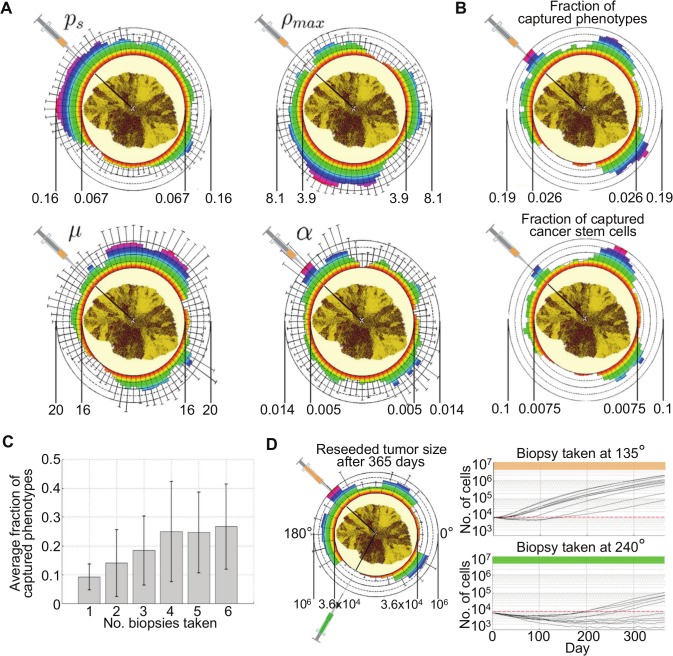
Fig 4. A) Distribution of average parameter values and standard deviations in biopsy samples taken at 5-degree intervals around the tumor.
Color-coded heat map to further emphasize variation. ps: probability of symmetric division; ρmax: proliferation potential; μ: migration rate, α: spontaneous cell death probability. B) Fraction of captured phenotypes (ratio of unique phenotypes in a sample to the total number of unique phenotypes in the whole tumor) and fraction of cancer stem cells (ratio of CSC count to the total cell count within the collected sample) in biopsy samples taken at 5-degree intervals around the tumor. C) Average fraction of phenotypes captured with multiple equally distant biopsies within a 90-degrees tumor quadrant. D) Different tumor growth dynamics of re-seeded subpopulations from biopsy samples (10 subpopulations, ~10,000 cells each) taken at 135° (orange) and 240° (green).

