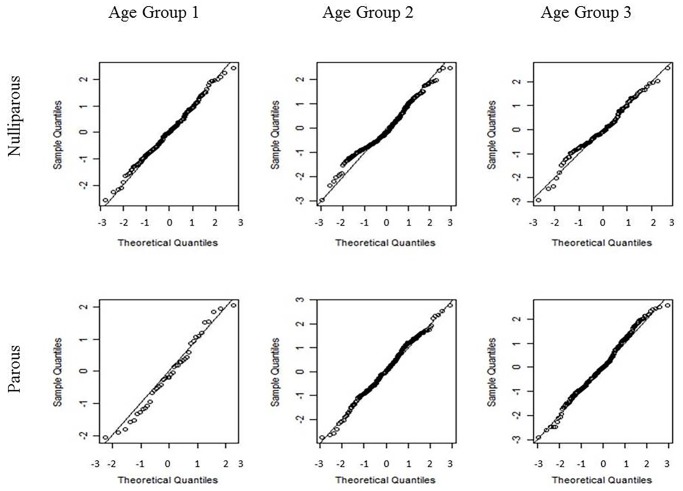
Fig 4. Quantile-quantile (Q-Q) plots of the standardized residuals of model (2) for each combination of age and parity groups.
Nulliparous women are presented in the first row, and parous women are presented in the second row. The age group increases from the left to right columns. From left to right and from top to bottom, the Lilliefors-corrected Kolmogorov-Smirnov normality test calculated p-values of 0.738, <0.001, 0.111, 0.954, 0.082, and 0.373, respectively.

