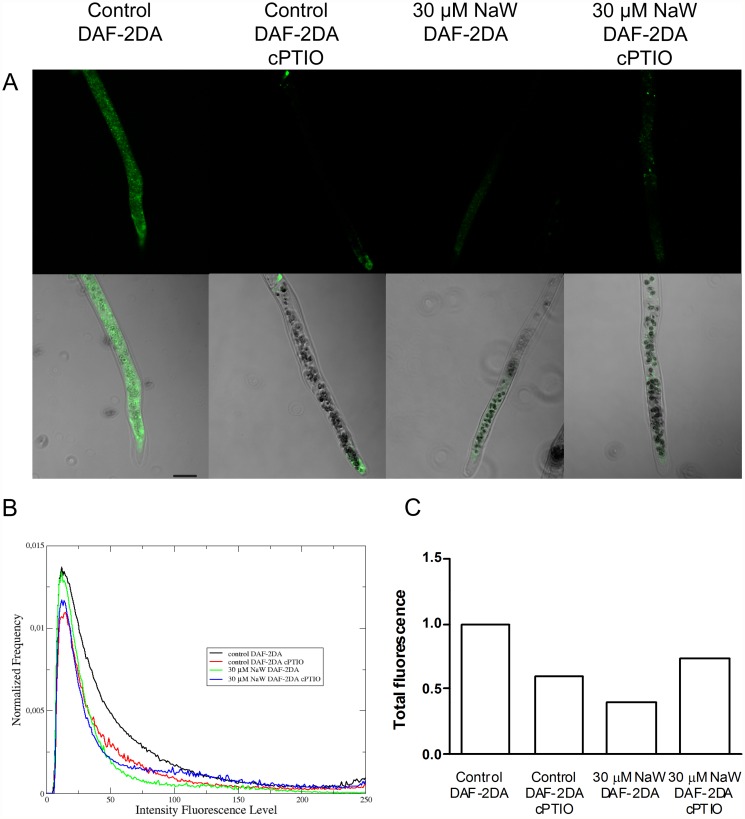
Fig 5. Nitric oxide detection in P. patens protonemal cells by confocal laser scanning microscopy.
A) DAF-2DA green emission by protonemal cells grown for seven days on Knop medium or medium supplemented with 30 μM sodium tungstate. Protonema was incubated in growth medium supplemented with 20 μM DAF-2DA for 15 min. Some plants were preincubated with 200 μM cPTIO for 45 minutes and then with DAF-2DA. Green signal indicates •NO production. The micrographs show pairs of representative laser confocal microscopy and bright-field images of the protonemal cells. Scale bar = 50 μm. B) Normalized average histograms, each curve describes the DAF-2DA green emission intensity distribution associated to a specific experimental treatment. C) For each treatment, the total DAF-2DA green emission intensity was obtained based on the area under the curves shown in B, and normalized according to DAF-2DA green signal intensity from untreated control. Data from two independent experiments (n = 22–28). The statistical independence between the distributions (B) was calculated using the Kolmogorov-Smirnov test.

