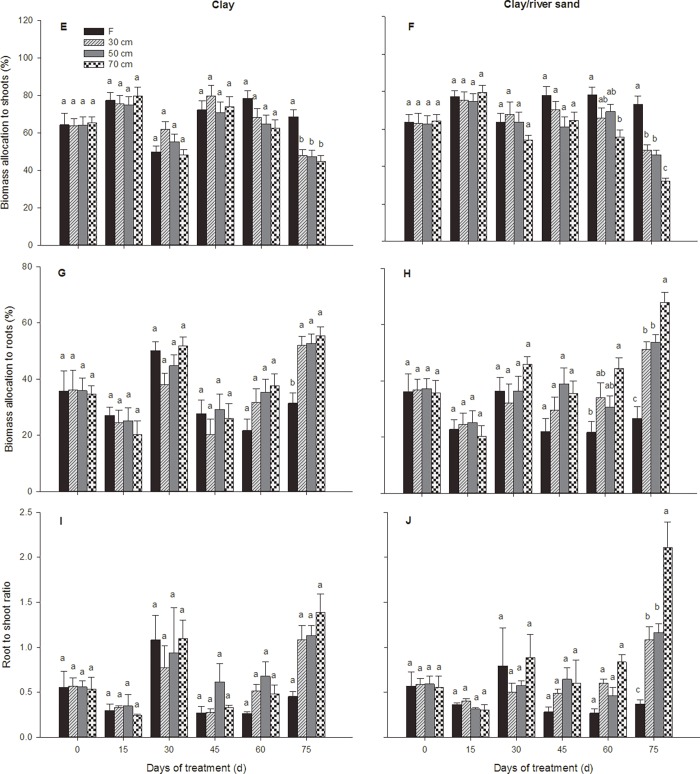
Fig 2. Biomass allocation dynamics of P. euphratica seedlings subjected to different treatments.
Changes over time in the relative weights of shoots (E, F), relative weights of roots (G, H) and the root-to-shoot ratio (I, J) of P. euphratica seedlings subjected to each watering treatment in the clay sediment and the clay/river sediment (F = inundation treatment; 30 cm = 30 cm water table depth treatment; 50 cm = 50 cm water table depth treatment; 70 cm = 70 cm water table depth treatment. Each point represents the mean (±S.E.) value for 5 plants. The letters in the tables indicate homogeneous subsets (Tukey’s tests) at 15, 30, 45, 60 and 75 days.

