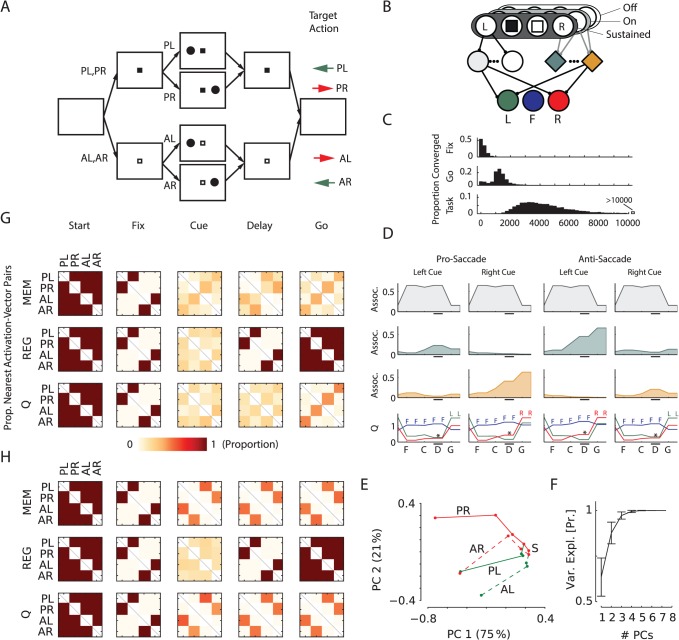
Fig 2. Saccade/antisaccade task.
A, Structure of the task, all possible trials have been illustrated. Fixation mark color indicates whether a saccade (P) or anti-saccade (A) is required after a memory delay. Colored arrows show the required action for the indicated trial types. L: cue left; R: cue right. B, The sensory layer represents the visual information (fixation point, cue left/right) with sustained and transient (on/off) units. Units in the Q-value layer code three possible eye positions: left (green), center (blue) and right (red). C, Time course of learning: 10,000 networks were trained, of which 9,945 learned the task within 25,000 trials. Histograms show the distribution of trials when the model learned to fixate (‘fix’), maintain fixation until the ‘go’-signal (‘go’) and learned the complete task (‘task’). D, Activity of example units in the association and Q-layer. The grey trace illustrates a regular unit and the green and orange traces memory units. The bottom graphs show activity of the Q-value layer cells. Colored letters denote the action with highest Q-value. Like the memory cells, Q-value units also have delay activity that is sensitive to cue location (* in the lower panel) and their activity increases after the go-signal. E, 2D-PCA projection of sequence of association layer activations for the four different trial types for an example network. S marks the start of the trials (empty screen). Pro saccade trials are shown with solid lines and anti-saccade trials with dashed lines. Color indicates cue location (green – left; red – right) and labels indicate trial type (P/A = type pro/anti; L/R = cue left/right). Percentages on the axes show variance explained by the PCs. F, Mean variance explained as a function of the number of PCs over all 100 trained networks, error bars s.d. G, Pairwise analysis of activation vectors of different unit types in the network (see main text for explanation). MEM: memory; REG: regular. This panel is aligned with the events in panel (A). Each square within a matrix indicates the proportion of networks where the activity vectors of different trial types were most similar. Color scale is shown below. For example, the right top square for the memory unit matrix in the ‘go’ phase of the task indicates that around 25% of the networks had memory activation vectors that were most similar for Pro-Left and Anti-Right trials. H, Pairwise analysis of activation-vectors for networks trained on a version of the task where only pro-saccades were required. Conventions as in (G).

