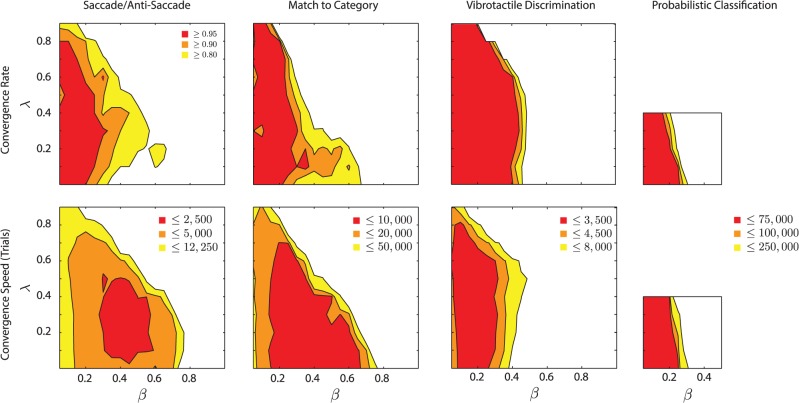
Fig 7. Robustness to variations in the parameters that control learning rate.
The upper row shows how the proportion of networks that converged varies as function of β (learning rate) and λ (decay of tags); white regions had a proportion of convergence lower than 0.8. The lower row shows the effect of β and λ on the median trial when the learning criterion was reached; white regions reached convergence later than the yellow regions (see insets).

