
Figure 4.
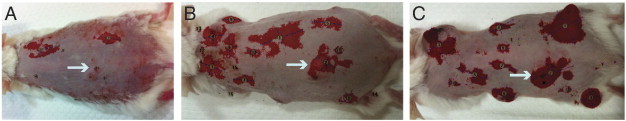
Sequential in vivo imaging of P14 mice shows development of macroscopic tumors. This is an overlay of the unmixed fluorescence image (thresholded) and color photograph of the same mouse corresponding to (A) Day 1, (B) Day 17, and (C) Day 27. Between Day 1 and Day 17, 3 macroscopic tumors developed from suspect ROIs (region of interest; potential microscopic tumor sites). Between Day 17 and Day 27, 7 macroscopic tumors emerge from suspect ROIs. The arrows follow tumor growth and corresponding fluorocoxib A signal of one region.