
Figure 6.
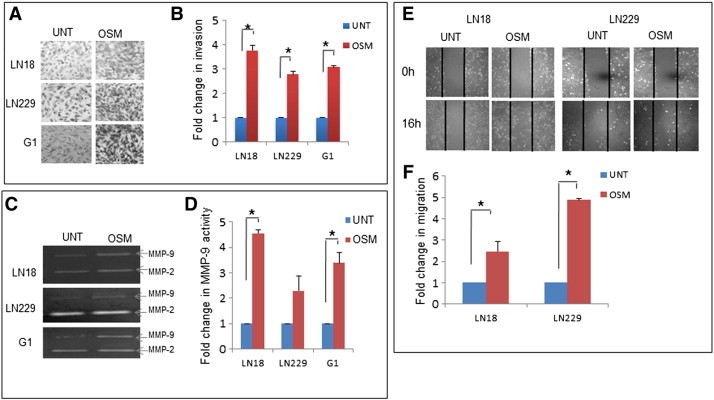
OSM enhances the invasion and migration in GBM. (A) Invasive potential of LN18, LN229 and G1 assessed using matrigel invasion assay. Graphical representation of the fold change estimated from absorbance values at 540 nm. Data is represented as mean +/− SD of two experiments done in duplicates. *p < 0.05, untreated vs. OSM (50 ng/ml) treated. (B) MMP-9 and MMP-2 levels of LN18, LN229 and G1 estimated using conditioned medium subjected to gelatin zymography analysis. The zymogram is representative of three independent experiments. Graphical representation of the mean densitometric values of MMP-9 band. Data is represented as mean +/− SD of three experiments. *P < .05 untreated vs. OSM (50 ng/ml) treated. (C) Migration capacity of LN18 and LN229. The images are representative of three independent experiments. Data is represented as mean +/− SD of two experiments done in duplicates. *P < .05 untreated vs. OSM (50 ng/ml) treated.