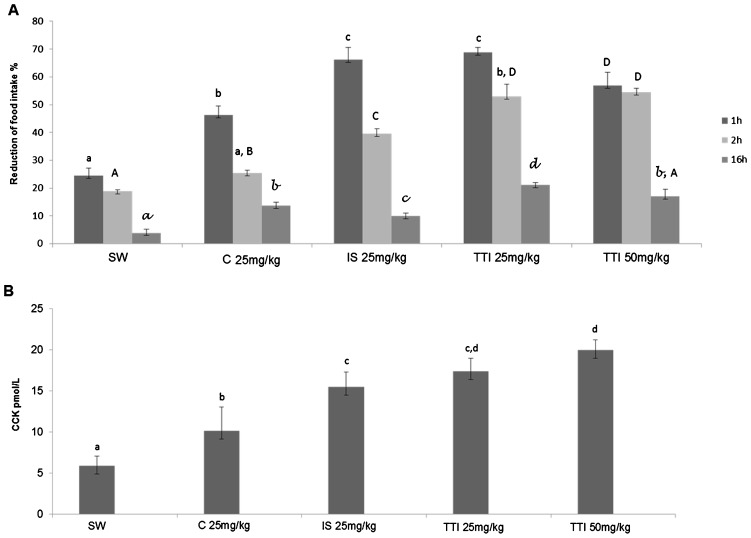
Figure 3.
Wistar rats were subjected to oral gavage using the AIN-93G standard diet +1 mL of water (SW, n = 6), AIN-93G+25 mg/kg casein in 1 mL water (25 mg/kg C, n = 6), AIN-93G+25 mg/kg soybean trypsin inhibitor in 1 mL water (25 mg/kg IS, n = 6), AIN-93G+25 mg/kg tamarind trypsin inhibitor in 1 mL water (25 mg/kg TTI, n = 6) and AIN-93G+50 mg/kg tamarind trypsin inhibitor in 1 mL water (50 mg/kg TTI, n = 6) for 11 days. A) Food consumption (%) after 1 h, 2 h and 6 h of gavage in the studied groups. B) Plasmatic CCK levels after 1 h of gavage in the studied groups. The results are expressed as the mean ± standard deviation of each group. Different letters indicate p<0.05 using one-way ANOVA and Tukey's post-hoc test.

