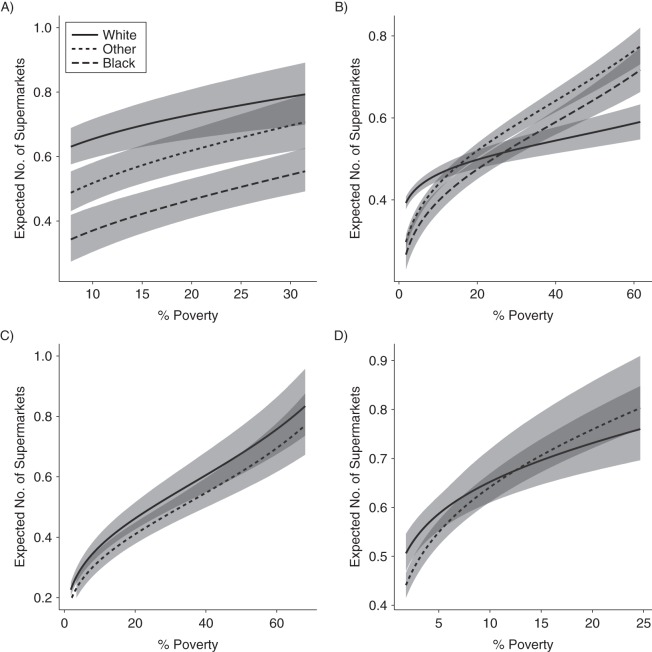
Figure 1.
Estimated numbers of supermarkets in the Birmingham, Alabama (A), Chicago, Illinois (B), Minneapolis, Minnesota (C), and San Francisco, California (D), Metropolitan Statistical Areas (MSAs), by census tract poverty (percentage of the population living below the federally defined poverty level) and racial/ethnic composition, 2006–2012. Numbers of census tracts (2010 census tract boundaries) falling within the MSAs: Birmingham, 264; Chicago, 2,210; Minneapolis, 772; San Francisco, 975. Predominantly white or predominantly black tracts were defined as tracts with ≥70% of the tract population of a specific race/ethnicity. All other racial/ethnic categories, such as predominantly Hispanic, predominantly Asian, or racially mixed, were lumped together in the “other” category, given the small sample sizes available for analysis. Average tract area and population specific to each MSA were included in the space-time Poisson regression models to generate realistic supermarket counts. Continuous variables worked well with the regression models for all 4 MSAs. The shaded band indicates the 95% credible interval.

