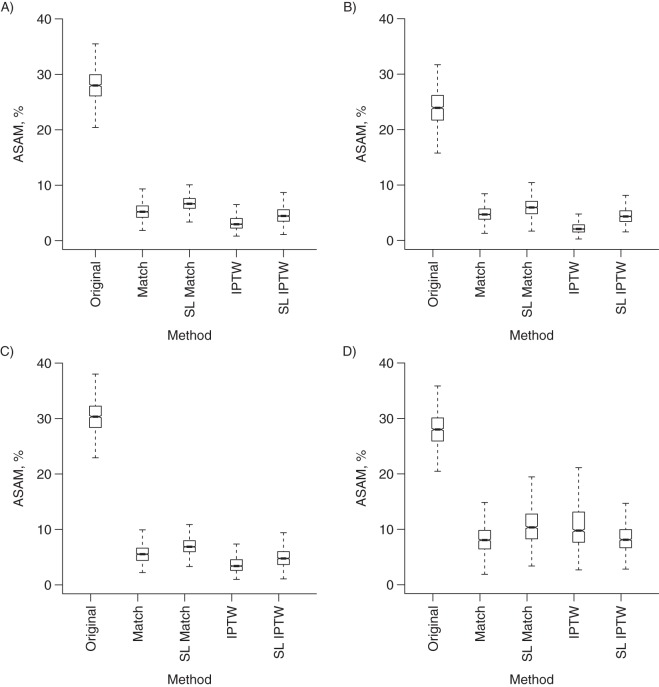
Figure 1.
Distribution of the average standardized absolute mean difference (ASAM) for each method and each scenario. The ASAMs are expressed as percentages. A) Scenario A (i.e., additivity and linearity (main effects only)); B) scenario B (i.e., nonlinearity (3 quadratic terms)); C) scenario C (i.e., nonadditivity (10 two-way interaction terms)); D) scenario D (i.e., nonadditivity and nonlinearity (10 two-way interaction terms and 3 quadratic terms)). The midline represents the mean value, and the dashed lines show the 2.5% and 97.5% quantiles.

