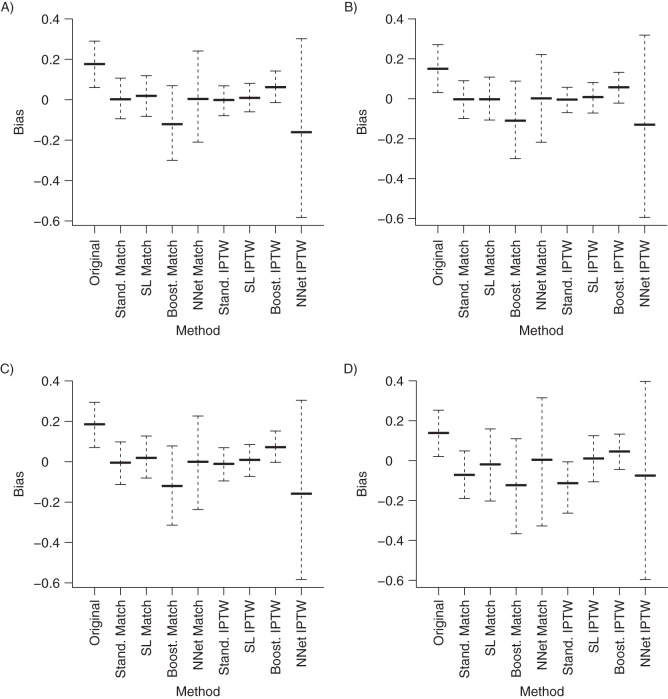
Figure 2.
Distribution of the absolute bias for each method and each scenario. The y-axis represents the bias as defined by the point estimate minus truth. A) Scenario A (i.e., additivity and linearity (main effects only)); B) scenario B (i.e., nonlinearity (3 quadratic terms)); C) scenario C (i.e., nonadditivity (10 two-way interaction terms)); D) scenario D (i.e., nonadditivity and nonlinearity (10 two-way interaction terms and 3 quadratic terms)). The midline represents the mean value, and the dashed lines show the 2.5% and 97.5% quantiles. Boost. IPTW, boosted CART IPTW; Boost. Match, boosted CART matching; CART, classification and regression trees; IPTW, inverse probability of treatment weighting; NNet IPTW, Neural Networks IPTW; NNet Match, Neural Networks matching; SL, Super Learner; SL IPTW, Super Learner IPTW; SL Match, Super Learner matching; Stand. IPTW, standard IPTW estimator; Stand. Match, standard matching estimator.

