Figure 3.
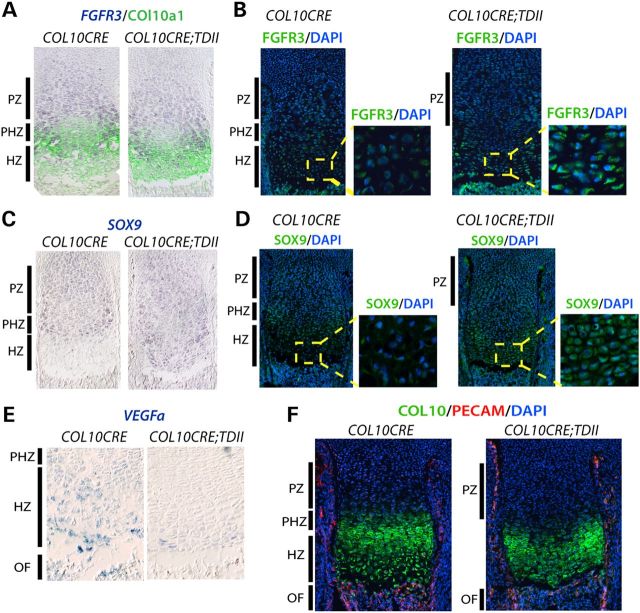
Failure to downregulate SOX9 is linked to poor expression of VEGFa and poor vascularization at the ossification front of COL10CRE;TDII long bones. (A) FGFR2 ISH and COL10a1 co-staining as indicated. (B) Immunohistochemistry (IHC) of FGFR3 (green) with DAPI (blue) co-staining. (C) SOX9 ISH as indicated. (D) IHC of SOX9 (green) with DAPI co-staining. (E) VEGFa ISH with higher magnifications of the hypertrophic zone (red boxed area) as indicated. (F) Combined COL10a1, PECAM and DAPI staining as indicated. All images are of E18.5 proximal tibia with the approximate location of the different zones of control growth plates indicated.

