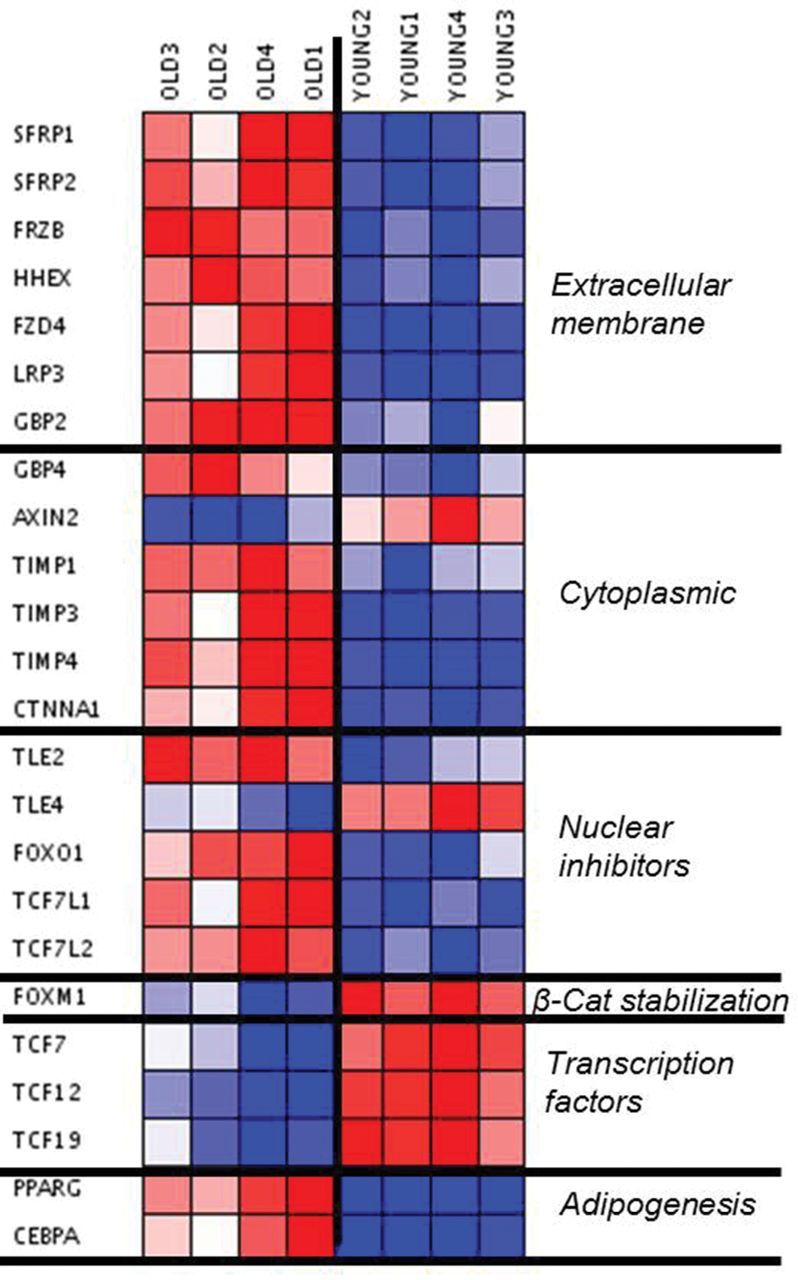
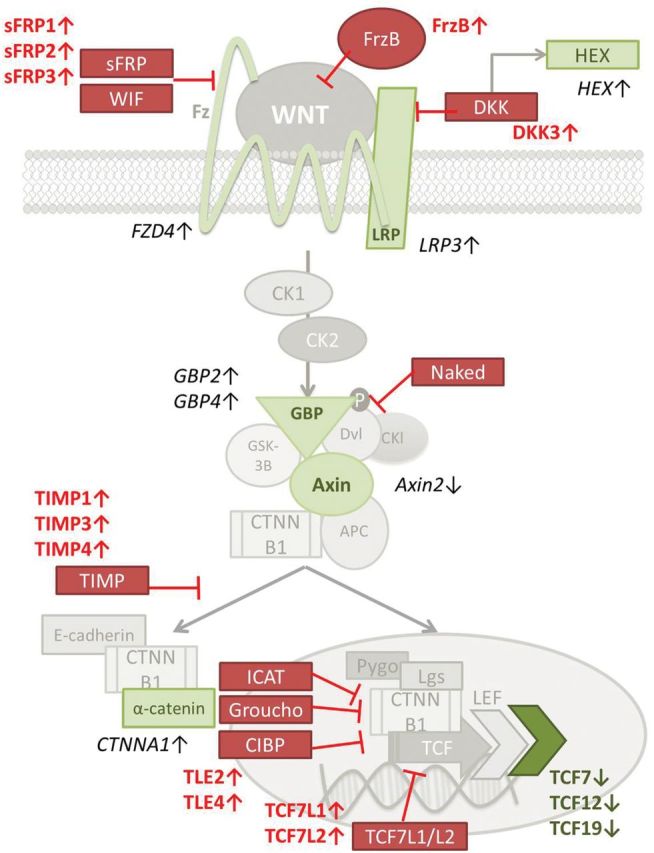
Figure 2.


(A) Visual representation (heat map) of WNT-related altered genes. Downregulated = blue. Upregulated = red. (B) Schematic representation of the WNT pathway. The results of the microarray analysis showed the red-marked WNT mediators as upregulated, whereas green-marked WNT mediators were found downregulated, in involuted (elderly) thymus samples. Four thymic tissue samples were analyzed for each group.
