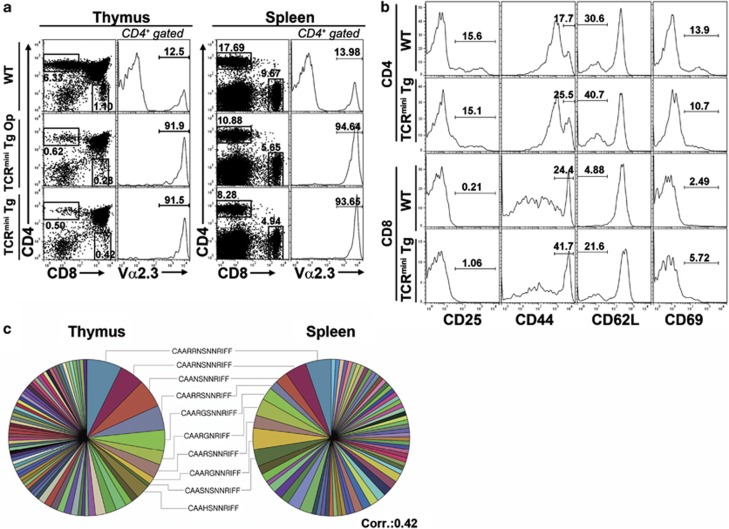
Figure 1.
Thymic selection and maturation in TCRmini Tg mice. (a) Development of thymic and splenic T-cell populations in TCRmini Tg mice. The profiles of the CD4+ and CD8+ T cells were obtained from three mice each of the following types: WT, Mini1.1/Cα−/− (TCRmini Tg Op), and Mini1.1/Cα−/−Vβ5.2 (TCRmini Tg). The histograms represent gated CD4 SP thymocytes or CD4+ splenocytes (number of total thymocytes in WT mice: 10.99±2.37 × 10⁷, TCRmini Tg Op: 11.49±3.32 × 10⁷, TCRmini Tg: 10.95±4.43 × 10⁷; number of total splenocytes in WT mice: 8.27±0.98 × 10⁷, TCRmini Tg Op: 5.96±0.66 × 10⁷, TCRmini Tg: 5.53±2.29 × 10⁷). (b) Activated phenotype of splenic CD4+ and CD8+ T cells of C57BL/6 and TCRmini Tg mice, respectively: these cells were stained with PE-conjugated anti-CD25, anti-CD44, anti-CD62L and anti-CD69. (c) Four cell populations (CD4+CD8−CD24lowTCRβ5.2hi and CD4−CD8+CD24lowTCRβ5.2hi SP thymocytes and CD4+CD8−TCRβ5.2hi and CD4−CD8+TCRβ5.2hi splenocytes) pooled from two TCRmini Tg mice were sorted into 96-well plates (one cell per well). Each well was checked for Vα2 expression and CDR3α sequences between Vα2.3-Jα31 by RT-PCR and nested PCR. Pie charts were generated based on the CDR3α sequences of the CD4+CD8−CD24lowTCRβ5.2hi SP thymocytes (total cell number=137; number of different sequences=79) and CD4+CD8−TCRβ5.2hi splenocytes (total cell number=117; number of different sequences=71). Each color in the pie chart represents a different CDR3α sequence; several of the colors are used repeatedly for different sequences because of the high level of diversity. The area of each pie segment reflects the respective frequency of each TCRα sequence. The data are representative of two independent experiments.

