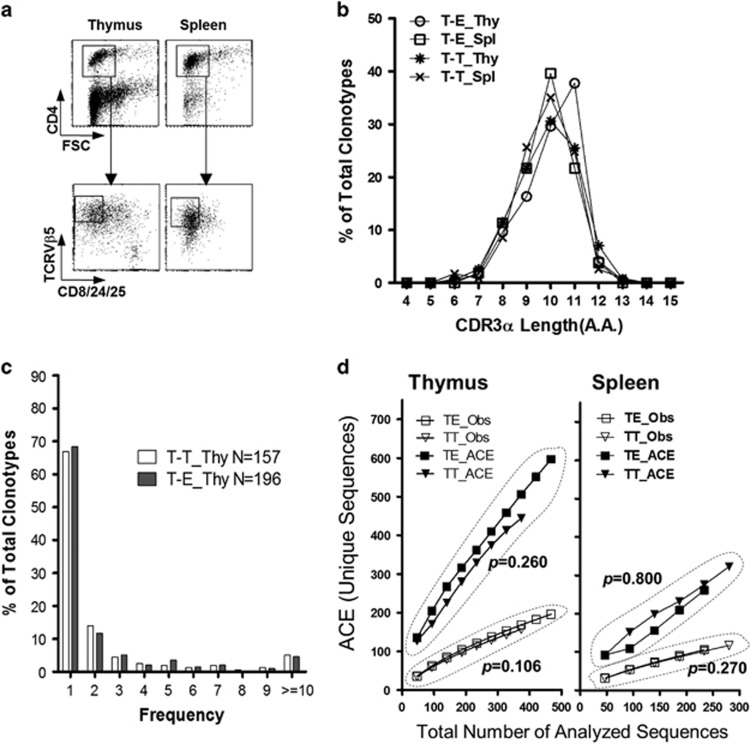
Figure 3.
Extensive TCR diversity determined by thymocyte–thymocyte interactions. (a) Thymocytes and splenocytes were extracted from the T-T TCRmini and T-E TCRmini mice, and CD8+ cells were depleted by magnetic cell sorting. The remaining cells were stained with anti-CD4-APC, anti-CD8/24/25-FITC and anti-TCRVβ5.1&5.2-PE Abs, and the gated populations were subjected to single-cell sorting into 96-well PCR plates using a FACSAria. (b) CDR3α length distributions for TCR sequences obtained from pooled CD4 SP thymocytes or splenic CD4+ T cells from the T-T TCRmini and T-E TCRmini mice (n=2 each). The y axis indicates the proportion that the number of clonotypes found with each CDR3α length represents among all clonotypes. (c) A power-law distribution for the TCR CDR3α frequencies in the CD4 SP thymocytes in both mouse systems is shown, based on the number of occurrences in each population (n=157 and n=199 for T-E TCRmini and T-T TCRmini, respectively). (d) The total number of unique protein sequences obtained from CD4 SP thymocytes and splenic CD4+ T cells from T-T TCRmini and T-E TCRmini mice was estimated on the basis of the number of unique sequences observed (Obs) and the ACE (upper row). The ACE estimates the percentage of individuals with rare sequences (that is, those sequences found 10 times or less) based on abundance data. The ACE was calculated following a published method.44 The empirical P-values were estimated from a one-tailed permutation test.24 Spl, spleen; T-E, T-E TCRmini; Thy, thymus; T-T, T-T TCRmini.

