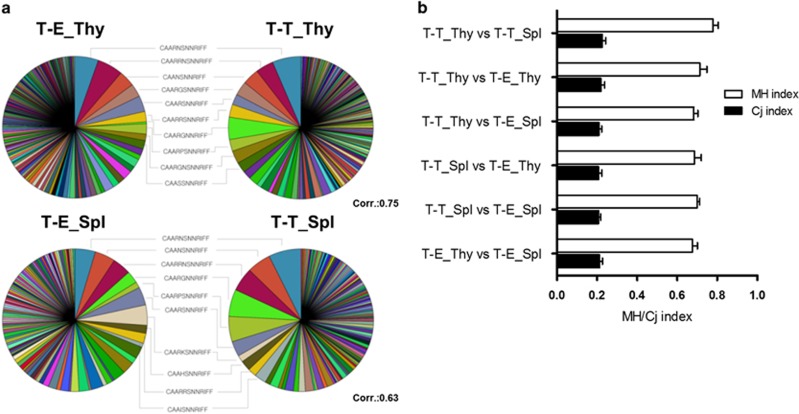
Figure 4.
Clonal similarities between the TCR repertoires derived from T-T and T-E interactions. (a) Pie charts for the CDR3α sequences obtained from the single-cell RT-PCR products of CD4 SP thymocytes (upper row) and CD4+ splenocytes (lower row) from the T-T TCRmini and T-E TCRmini mice (N=376 and N=467 for T-T_Thy and T-E_Thy, respectively; N=261 and N=218 for T-T_Spl and T-E_Spl, respectively). The 10 most abundant and shared sequences between the T-T TCRmini and the T-E TCRmini mice are listed between the pie charts. (b) The Cj and MH similarity indices were calculated using normalized samples (10 000 iterative samplings). The value of these indices ranges from 0 (no similarity) to 1 (complete agreement). The Cj index is defined as the number of common CDR3α sequences divided by the total number of CDR3α sequences in two repertoires, and the MH index addresses the frequency of each CDR3 sequence. The results are shown as the mean±s.d. from 10 000 iterations.

