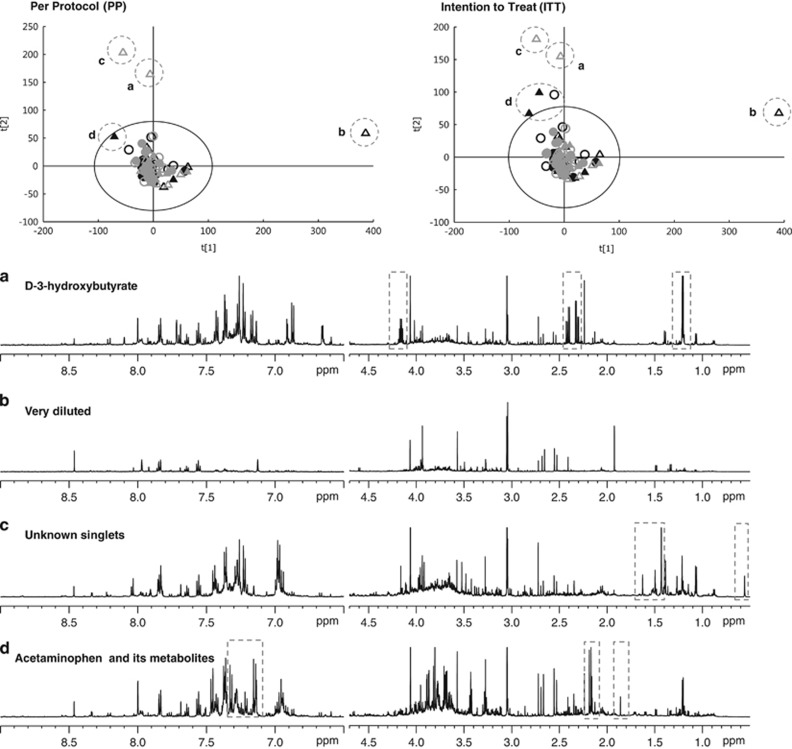
Figure 2.
The upper plots illustrated PCA scores plots derived from 1H NMR spectra of urinary samples collected from children at baseline (black) and after 6 months intervention (grey) in per protocol (PP) analyses and intention to treat (ITT), respectively. Open triangles for girls placebo group; closed triangles for girls active group; open circles for boys placebo group; closed circles boys active group. Six strong outliers are observed, and their NMR spectra are shown in panels a–d. Outlier (a) contains a high concentration of D-3-hydroxybutyrate. Outlier (b) is due to its extreme dilution of the sample. Outlier (c) shows a set of unknown singlets at 0.54, 0.43 and 1.62 p.p.m. Group (d) exhibit signals of acetaminophen and its metabolites.

