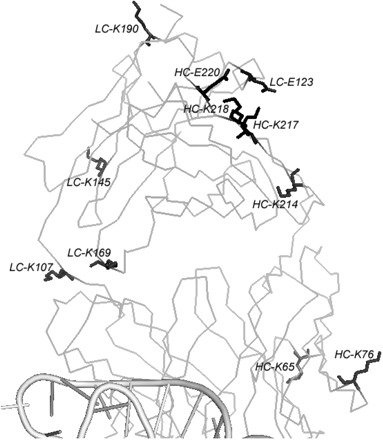
Fig. 1.

Crystal structure of ΔC209 P4–P6/Fab2 complex and the surface entropy mutation sites. RNA is shown in cartoon and is only partially shown (bottom). Fab scaffold is shown in ribbon. Five surface mutation sites are shown in black sticks. Other residues picked by visual inspection are shown in grey sticks.
