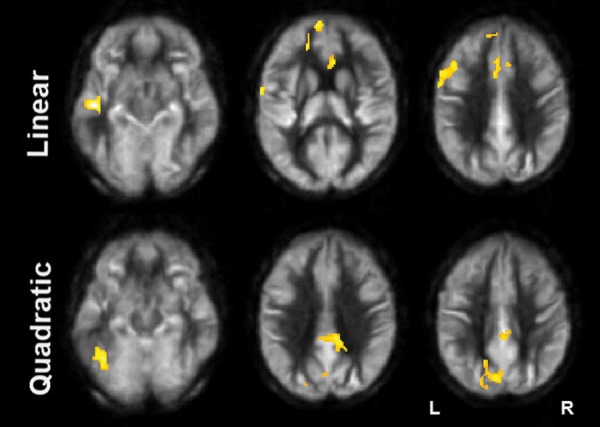
Figure 1.

Results of CBF voxel-based comparison superimposed on an average CBF map of all participants for linear and quadratic interaction contrasts at P < 0.05 (FWE corrected) and k ≥ 1904 mm3. Note: The regions experiencing a linear increase are located in the frontal lobe while the regions experiencing a quadratic pattern of CBF increase are located in the posterior.
