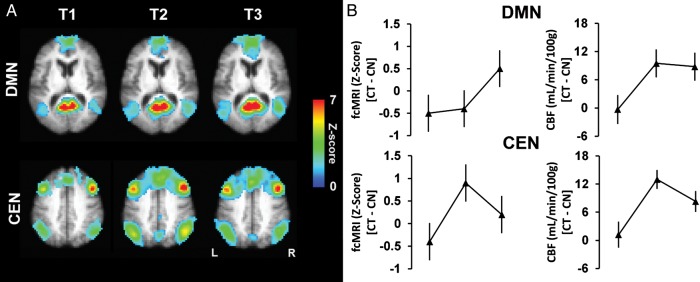
Figure 2.

(A) The average functional connectivity maps (i.e., DMN and CEN) of the cognitive training group are overlaid on their average T1-weighted image. For illustration purposes, the z-score maps were arbitrarily thresholded (z-score ≥ 1, k ≥ 50) to qualitatively visualize the change in the intensity and cluster size. (B) Mean change in fcMRI z-scores (left column) and mean change in absolute CBF (right column) are shown for DMN and CEN across time periods. The DMN shows an increase in both mean fcMRI and mean aCBF from T1 to T3 for the cognitive training (CT) group relative to controls (CN). The CEN shows a maximal increase in both mean fcMRI and mean aCBF at T2 for the cognitive training group relative to controls.
