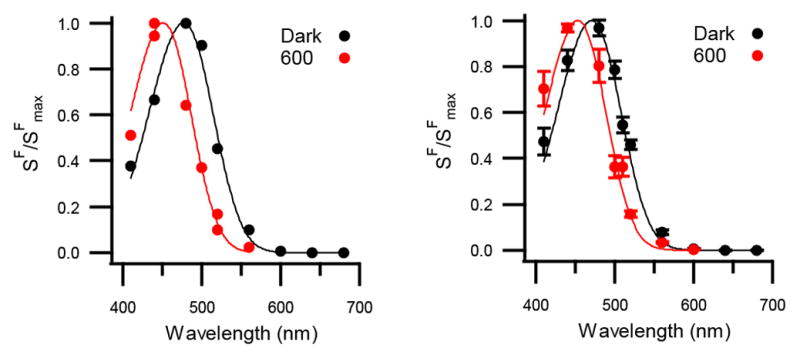
Figure 4. Two Silent States of Melanopsin Detected in IpRGCs.

Left: The spectral sensitivity (i.e., action spectrum) of a single ipRGC measured in darkness as well as during a 600-nm background light (black and red markers, respectively). Plotted is the sensitivity of the cell to dim-flashes of each test wavelength (SF, in pA photons−1 μm2) normalized to the maximum for this cell (SFmax). Continuous curves are single-state nomograms fit to the data with λmax = 471 nm (darkness) and 454 nm (600-nm background). Right: Population averages for the same conditions (mean ± SEM; n = 6 cells) with λmax = 471 nm (darkness, the “cyan” state) and 453 nm (600-nm background, the “violet” state). 600-nm background was delivered at 4×10⁶ – 7×10⁸ photons μm−2 s−1. Measurements were made at 35 and 23 °C with no detectable variation in λmax with temperature. Synaptic transmission was blocked and the holding voltage was −80 mV. See also Figure S3.
