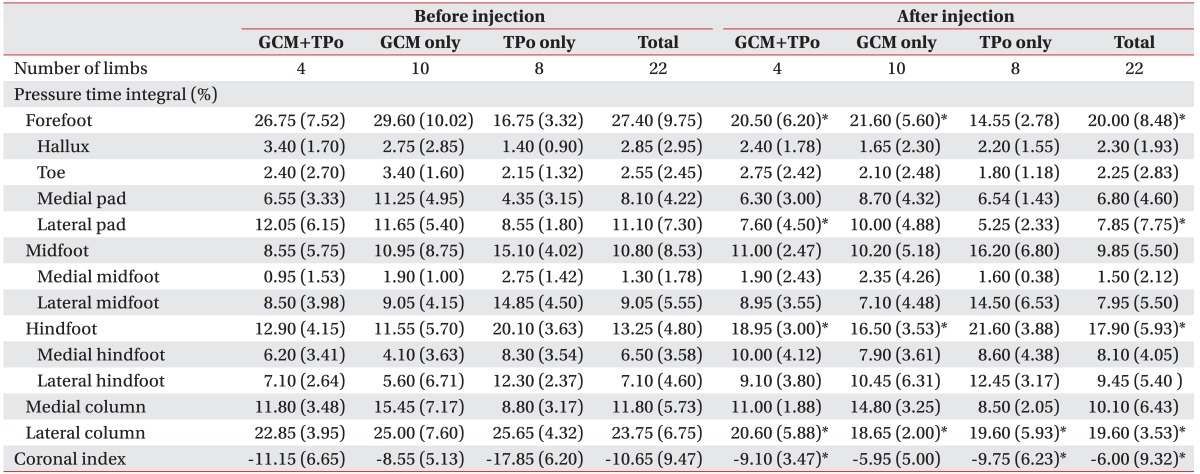
Table 3. The comparison of pressure time integral in the injected muscle between before and after injection of botulinum toxin A.

Values are presented as median (interquartile range)
GCM, gastrocnemius muscle; TPo, tibialis posterior muscle.
*p<0.05.
