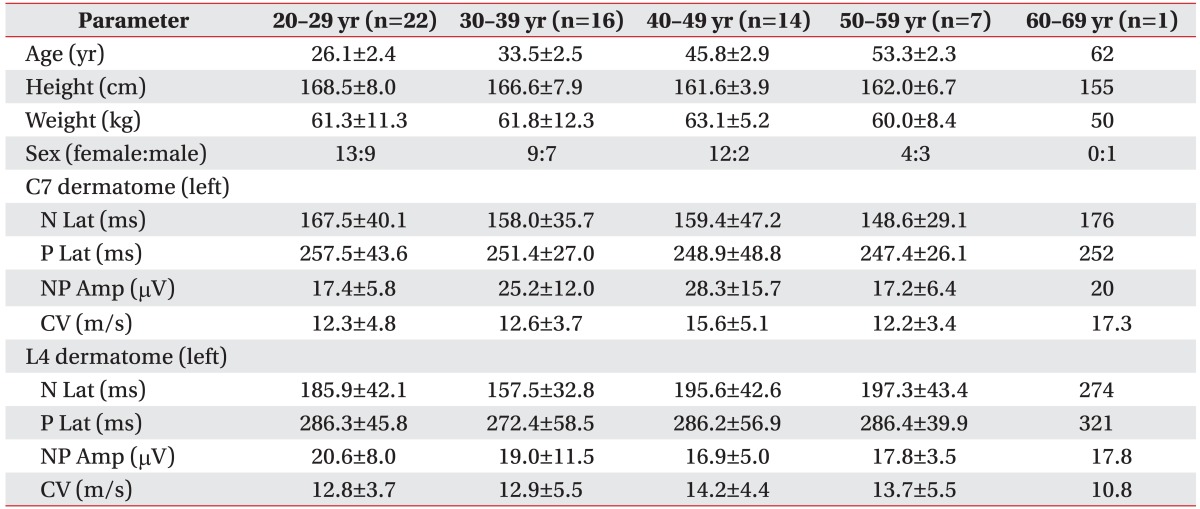
Table 4. Pain-related evoked potential data by age group.

Values are presented as mean±standard deviation.
N Lat, negative peak latency; P Lat, positive peak latency; NP Amp, peak-to-peak amplitude; CV, conduction velocity.

Values are presented as mean±standard deviation.
N Lat, negative peak latency; P Lat, positive peak latency; NP Amp, peak-to-peak amplitude; CV, conduction velocity.