
Figure 3.
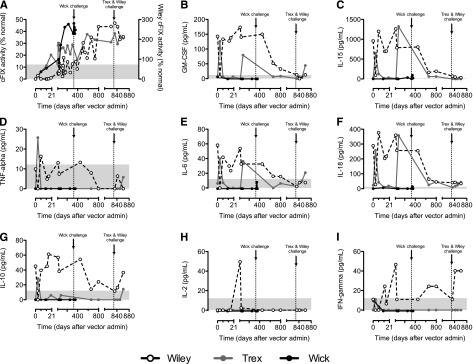
Cytokine profiles of dogs following AAV-cFIX-Padua liver gene therapy. A cytokine multiplex array was run to assess the levels of (B) GM-CSF, (C) IL-15, (D) TNF-α, (E) IL-6, (F) IL-18, (G) IL-10, (H) IL-2, and (I) IFN-γ compared with the (A) cFIX expression levels as measured by percentage cFIX activity in the 3 HB dogs (Wiley: red, right y axis for % activity; Trex: blue; Wick, green) at baseline and following delivery of AAV. Gray bars indicate level of detection of the assay.