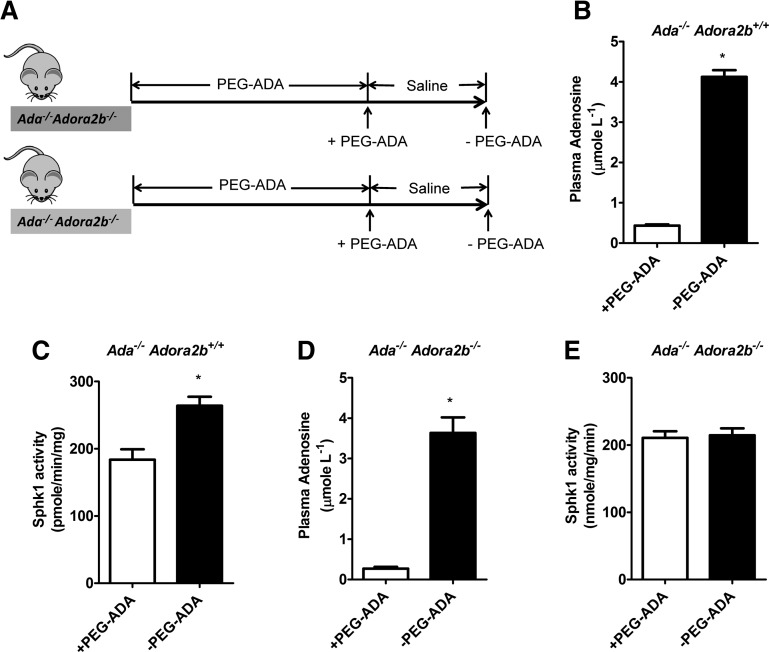
Figure 5.
Elevated plasma adenosine increases erythrocyte SphK1 activity through ADORA2B. (A) Schematic representation of mouse treatment strategy. (B) Plasma adenosine levels and (C) erythrocyte SphK1 activity in Ada−/− Adora2b+/+ mice before (+PEG-ADA) and after PEG-ADA treatment withdrawn (−PEG-ADA). (D) Plasma adenosine levels and (E) erythrocyte SphK1 activity in Ada−/− Adora2b−/− mice before (+PEG-ADA) and after PEG-ADA treatment withdraw (−PEG-ADA). Values shown represent the mean ± SEM (n = 6 for each group). *P < .05 −PEG-ADA vs +PEG-ADA.

