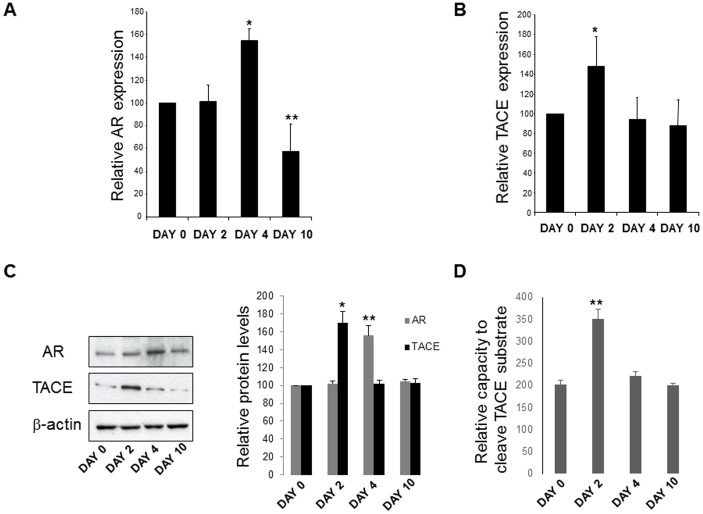
Figure 1. AR mRNA expression in hHSC.
(A) Cultures of hHSC show significantly higher expression (* p < 0.05) of AR by day 4 compared to day 0. Expression is effectively reduced by day 10 (** p < 0.01). (B) AR mRNA expression is preceded by the up-regulation of the TACE gene, required for AR activity. TACE expression is highest at day 2 (*p < 0.05) and is reduced by day 4 (**p < 0.01). (C) Western blot analysis for AR and TACE protein levels in hHSC at day 0, 2, 4 and 10 (left panel); images were obtained from separate gels, run under the same experimental conditions, blotted on separate PVDF membranes and processed for detection with the respective antibodies. Densitometric quantification normalized to β-actin levels (right panel). Images are representative of three independent experiments (* p < 0.05; ** p < 0.01). (D) TACE activities in hHSC at day 0, 2, 4 and 10 were measured using SensoLyte 520 TACE Activity Assay kit. N = 3, ** p < 0.01.

