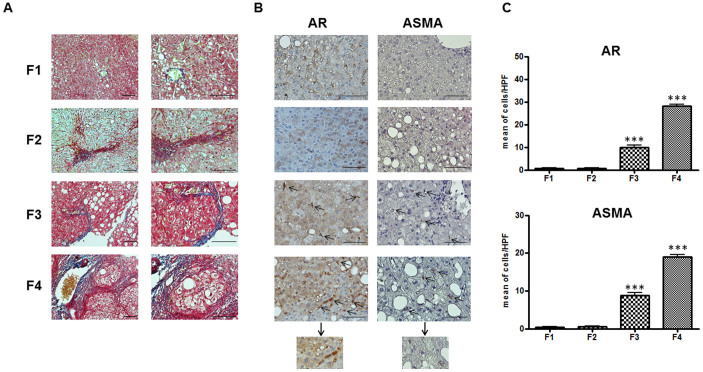
Figure 7. AR and ASMA expression in liver sections in fibrotic patients with increasing NASH severity (F1 to F4), according to both Brunt and NAS Scores; (n = 10).
(A) Representative pictures of Masson trichrome staining for collagen (green/blue) in samples with fibrosis F1 to F4. Bar: 100 μm. Magnification 400×. (B) Representative pictures of AR and ASMA immunostainings. Bar: 100 μm. Arrows indicate positive cells. Magnification 400×; highlighted insets were obtained with a magnification 1000×. (C) The quantification values of AR and ASMA immunopositive cells refer to the average number of positive cells for High Power Fields (HFP, 400×). Three independent observers examined the specimens. The means of triplicate counts were used for statistical analyses.

