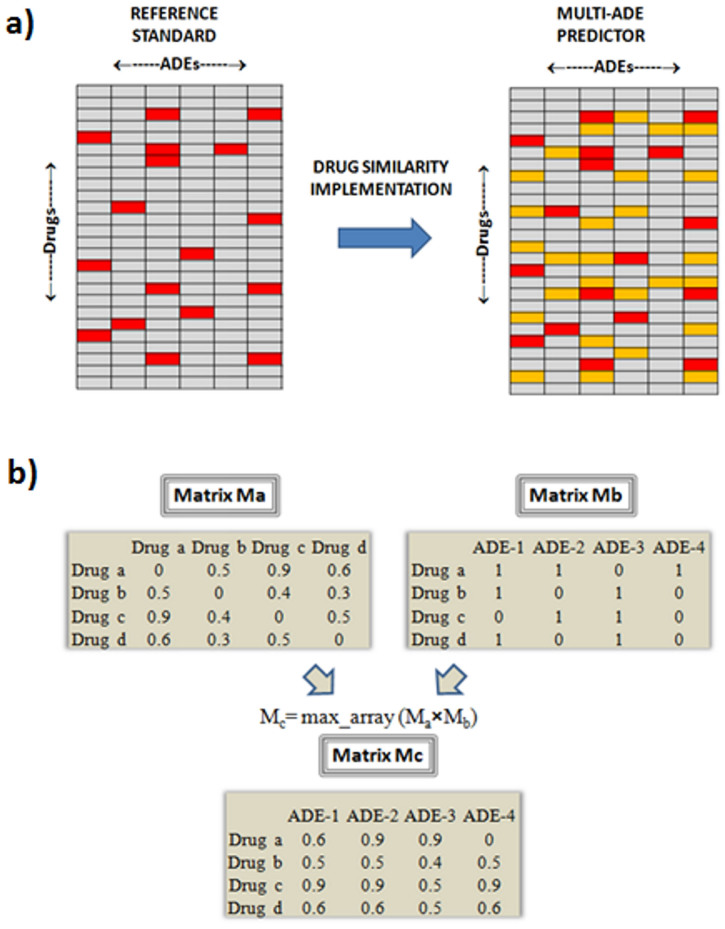
Figure 2.
Panel a) In the drug×ADE matrix (reference standard) is implemented the 3D drug similarity to develop the multi-ADE predictor. Drugs with associated ADEs in the reference standard are colored in red. Drugs predicted to be associated with the ADEs are colored in orange (new candidates); Panel b) Integration of the data in the model development. In the product of the drug-drug 3D similarity matrix (Ma) by the drug-ADE reference standard matrix (Mb) is retained in each cell the maximum value of the array-multiplication and the new matrix (Mc) containing the drug-ADE scores is obtained. As an example, “drug (a)” that causes the “ADE 2” is retrieved with a high score of 0.9. At the same time, “drug (a)” associated with the “ADE 3” (new candidate not present in the initial reference standard) is scored also with 0.9.

