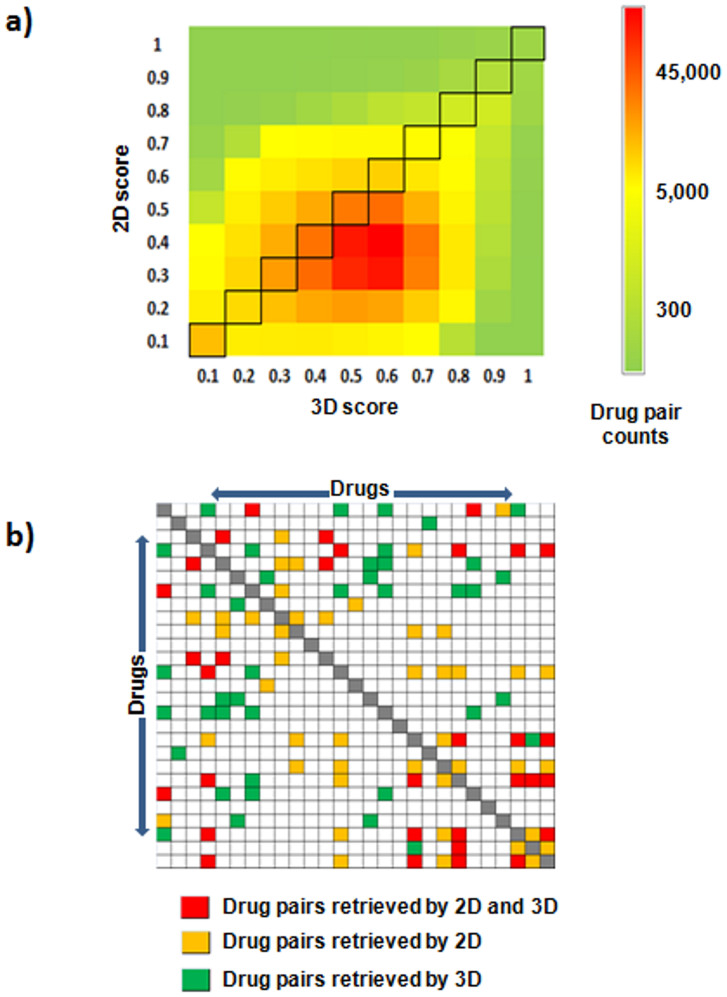
Figure 5.
Comparison between the similarities obtained using 2D MACCS and 3D methods for all the pairs of drugs included in the study (panel a). Panel b shows the overlap in the top 10% similarities detected by the 3D and 2D approaches (MACCS) for the set of drugs responsible for the ADE hyperpyrexia. Drug pairs detected by both methods are colored in red. In orange is represented the pairs pointed out only by the 2D method. Pairs of drugs detected by the 3D method in the top 10% are colored in green. The matrix is symmetric and the diagonal is represented in grey.

