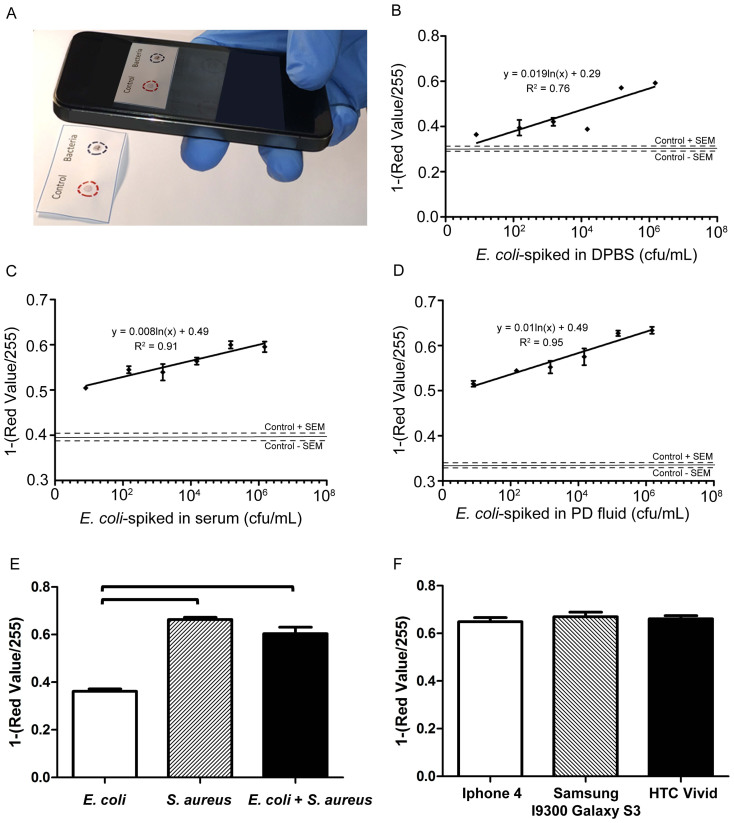
Figure 4. Cellulose paper-based nanoparticle aggregation for the detection of bacteria with a mobile phone system.
Bacteria-spiked samples were first added into the modified gold nanoparticle solution, and then, transferred to a cellulose paper for distribution of nanoparticles due to capillary effect. (A) The images of sample spots were taken using a mobile phone camera for image acquisition, and analyzed using an image processing MATLAB code in the computer. Red (R) pixel intensity value was used in the data analysis. (B) E. coli-spiked into DPBS samples ranging from 8 to 1.5 × 10⁶ CFUs/mL were evaluated. The limit of detection (LOD) was observed to be 8 CFUs/mL (n = 5). (C) E. coli-spiked into serum samples ranging from 8 to 1.5 × 10⁶ CFUs/mL were evaluated. The LOD was observed as 8 CFUs/mL (n = 5). (D) E. coli-spiked in PD fluid samples ranging from 8 to 1.5 × 10⁶ CFUs/mL were evaluated. The LOD was observed as 8 CFUs/mL (n = 5). E. coli-free solutions were used as control samples, and the corresponding signals were represented in line and dashes in the plots to show the mean and standard error of mean, respectively (n = 5). (E) Three sets of experiments were designed for multiplexing and specificity experiments. S. aureus (105 CFUs/mL) were applied into anti-LTA antibody-modified gold nanoparticle solution for multiplexing. E. coli (105 CFUs/mL) were sampled into anti-LTA antibody-modified gold nanoparticle solution for specificity. A mixed bacteria solution was examined with anti-LTA antibody-modified gold nanoparticle solution for nonspecific interactions. Statistical analysis demonstrated that S. aureus and mixture experiments were statistically different than E. coli samples (n = 5, p < 0.05), and there was no significant difference observed between S. aureus and mixture samples (n = 5, p > 0.05). (F) Evaluation of image code with other mobile phone cameras. S. aureus experiments were further assessed with iPhone 4, Samsung i9300 Galaxy S3 and HTC Vivid. There was no statistical difference between various mobile phone cameras (n = 5, p > 0.05). Statistical analysis was described in Supplementary Information. Brackets connecting individual groups indicate statistically significant difference. Error bars represent standard error of the mean.

