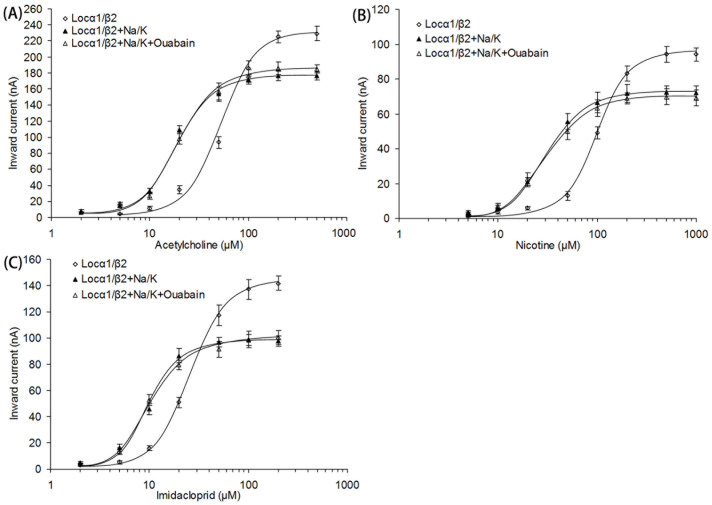
Figure 5. Effects of Na+/K+ ATPase on agonist sensitivities of nAChRs.
(A) Does-response curves for acetylcholine. (B) Does-response curves for nicotine. (C) Does-response curves for imidacloprid. The curves from the oocytes expressing nAChRs (L. migratoria manilensis subunit α1 and R. norvegicus subunit β2) were indicated by open squares. The curves from the oocytes co-expressing nAChRs and Na+/K+ ATPase (subunit α1 and β1) were indicated by solid triangles (without ouabain) and open triangles (with ouabain).

