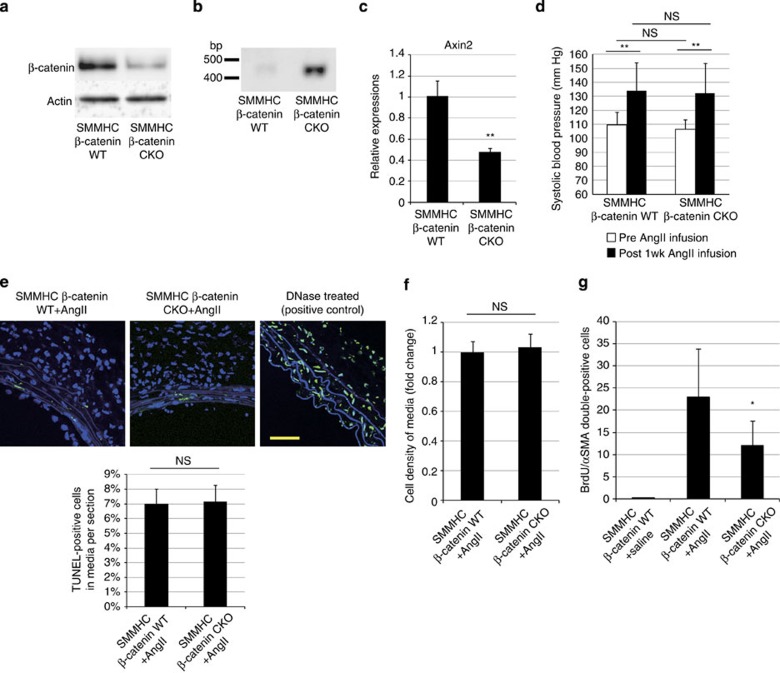
Figure 4. β-catenin signal activation is responsible for VSMC proliferation after AngII infusion.
(a) Western blot analysis. The amounts of β-catenin in the aortic tissues from SMMHC-CreERT2:Ctnnb1+/+ mice (SMMHC-β-catenin wild type (WT)) and SMMHC-CreERT2:Ctnnb1flox/flox mice (SMMHC-β-catenin CKO) were analysed in aortic tissues isolated 6 days after the final tamoxifen treatment. (b) PCR analysis of aortic tissue DNA. DNA extracted from aortic tissues of tamoxifen-treated SMMHC-β-catenin WT and SMMHC-β-catenin CKO mice were amplified with a PCR primer set designed for detecting the null allele. (c) Real-time PCR analysis for the expression level of the Axin2 gene (one of the major Wnt/β-catenin target genes) in the aortic tissue isolated from tamoxifen-treated SMMHC-β-catenin WT and SMMHC-β-catenin CKO mice. The values are shown as fold induction over SMMHC-β-catenin WT mice. **P<0.01 versus SMMHC-β-catenin WT mice. (d) Systolic blood pressure before and after AngII infusion for 1 week. There was no difference in systolic blood pressure between SMMHC-β-catenin WT mice and SMMHC-β-catenin CKO mice before and after AngII infusion. **P<0.01 versus Post 1wk AngII infusion. (e) TdT-mediated dUTP nick end labelling (TUNEL) staining of aortic tissue and percentage of TUNEL-positive cells. TUNEL staining of aortic tissue from SMMHC-β-catenin WT and SMMHC-β-catenin CKO mice 1 week after AngII infusion. The DNase (TACS nuclease)-treated section is presented as a positive control. Percentage of TUNEL-positive cells per total cells in aortic media was calculated. Scale bar, 50 μm. (f) Cell density of aortic media was calculated by measuring the number of αSMA-positive cells per field of view size (40 × 40 μm2). (g) The number of double-positive (BrdU(+)/αSMA(+)) cells per aortic section from 1-week saline-infused SMMHC-CreERT2:Ctnnb1+/+ mice (SMMHC-β-catenin WT+saline), 1-week AngII-infused SMMHC-CreERT2:Ctnnb1+/+ mice (SMMHC-β-catenin WT+AngII) and SMMHC-CreERT2:Ctnnb1flox/flox mice (SMMHC-β-catenin CKO+AngII). *P<0.05 versus SMMHC-β-catenin WT+AngII (n=12). The values are shown as fold induction over SMMHC-β-catenin WT mice (n=5). Statistical significance was determined using the unpaired two-tailed Student’s t-test for c, e and f, two-way analysis of variance followed by Sidak’s multiple comparisons test for d and the Kruskal–Wallis test with Dunn’s correction for multiple comparisons for g. Results are represented as mean±s.d. NS, not significant.

