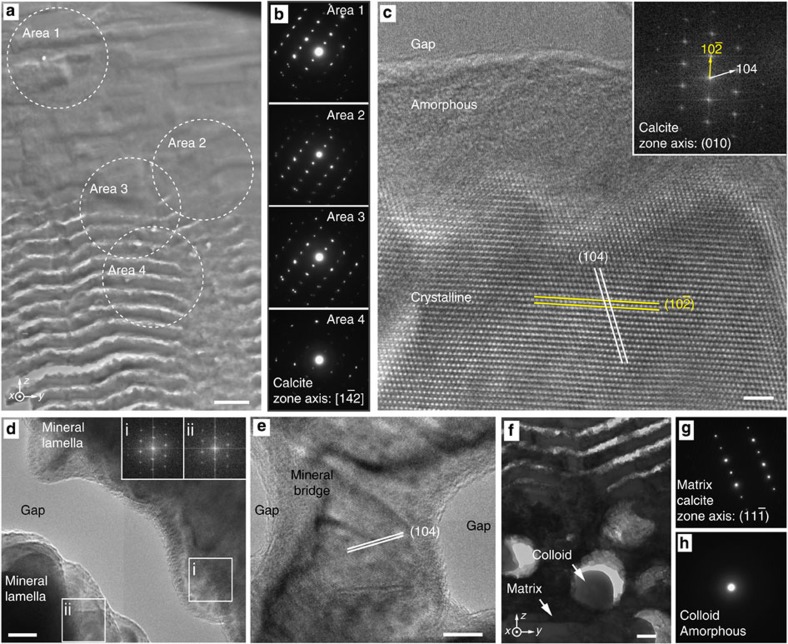
Figure 3. Crystallographic composition of the photonic architecture.
(a) TEM image of the upper transition zone between the dense lamellar matrix and the photonic multilayer. Scale bar, 400 nm. (b) Selected-area electron diffraction (SAED) patterns acquired from the areas marked in a, which are all indexed to calcite with a zone axis of  . This demonstrates that both the crystallographic phase and orientation are conserved across the transition zone. (c) High-resolution TEM image of the calcite crystal lattice in a single lamella. The top ~10 nm of the lamella appears to be amorphous while the remainder is crystalline. The inset shows the corresponding fast Fourier transform (FFT) pattern of the crystalline region (calcite with zone axis, [010]). Scale bar, 2 nm. (d) Parts of two lamellae from the photonic multilayer that are separated by a gap. FFT patterns of the adjacent edges (i, ii) are displayed in the inset, showing that the crystal orientation is preserved across the gap. Scale bar, 10 nm. (e) High-resolution TEM image showing a mineral bridge connecting two lamellae within the photonic multilayer, with the crystal lattice translating from one lamella to the next via the connection. Scale bar, 10 nm. (f) TEM image of the transition zone between the multilayer and the colloidal particle array. Scale bar, 200 nm. (g,h) SAED patterns of the surrounding crystalline matrix and amorphous colloids obtained from areas indicated in f.

