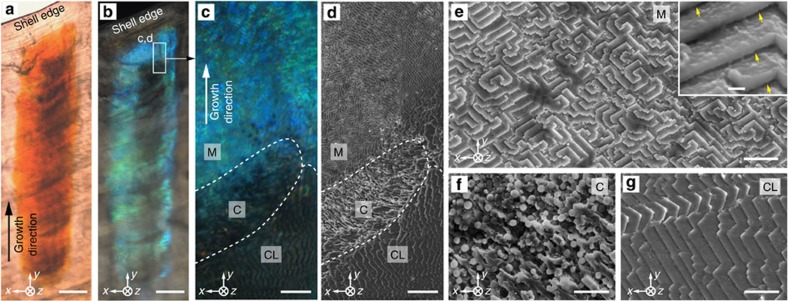
Figure 5. Micromorphology at the growth edge.
(a,b) Transmission and corresponding reflection optical micrographs of a stripe at a shell’s growth edge imaged from the shell interior. Scale bars, 50 μm. (c,d) High-resolution optical micrograph and SEM image acquired from the transition zone (marked in b) between the blue reflecting and non-reflecting areas. Three different regions are apparent: the multilayer region with high blue reflection ‘M’; the region covered with colloidal particles with decreased reflection intensity ‘C’; a cross-lamellar region with very low reflection intensity ‘CL’. Scale bars, 5 μm. (e–g) High-magnification SEM images of regions of ‘M’, ‘C’ and ‘CL’, respectively. The inset in e shows the gaps (yellow arrows) between the lamellae in region M. Scale bars, 2 μm, inset in e 200 nm.

