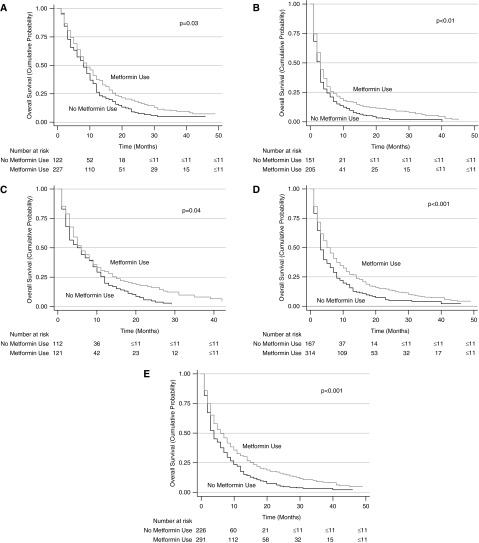
Figure 2.
Stratified Kaplan-Meier survival curves. Stratified by patients who received chemotherapy (A), patients who did not receive chemotherapy (B), patients who were treated with insulin (C), patients who were not treated with insulin (D), and patients who were treated with other oral medications (E).

