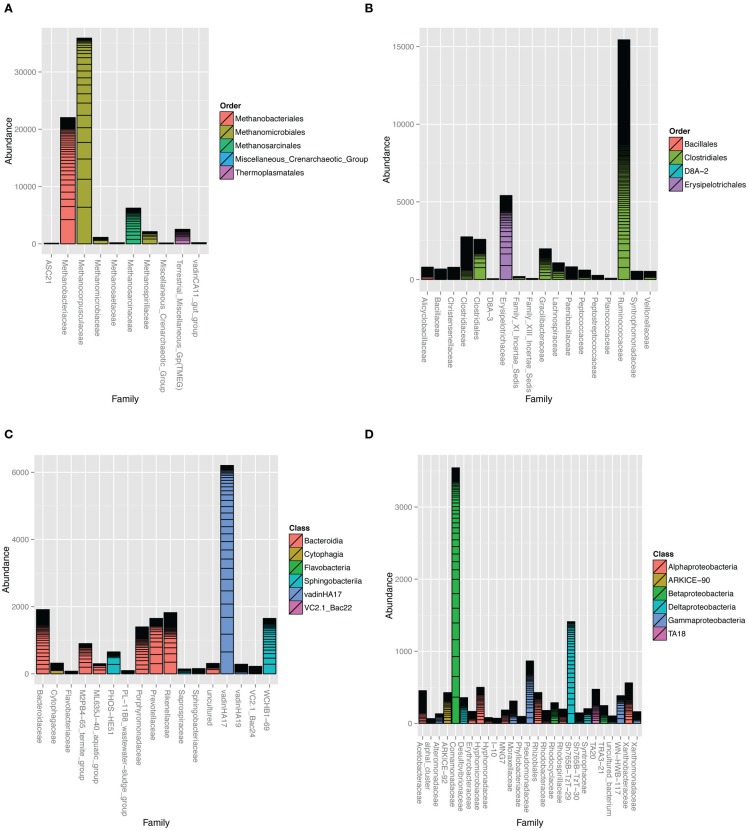
Figure 4.
Taxonomic summaries of read counts assigned to different families in the (A) Archaea domain and (B) Firmicutes, (C) Bacteroidetes, and (D) Proteobacteria phyla. Bars represent 90% homology cut-off OTUs stacked according to their abundance. Family bars are colored according to order. Vertical axis represents the number of pyrotag reads assigned to each family-level OTU. Barplots were constructed with the phyloseq (http://joey711.github.io/phyloseq/) suite of packages and dependencies in R version 2.15.2.

