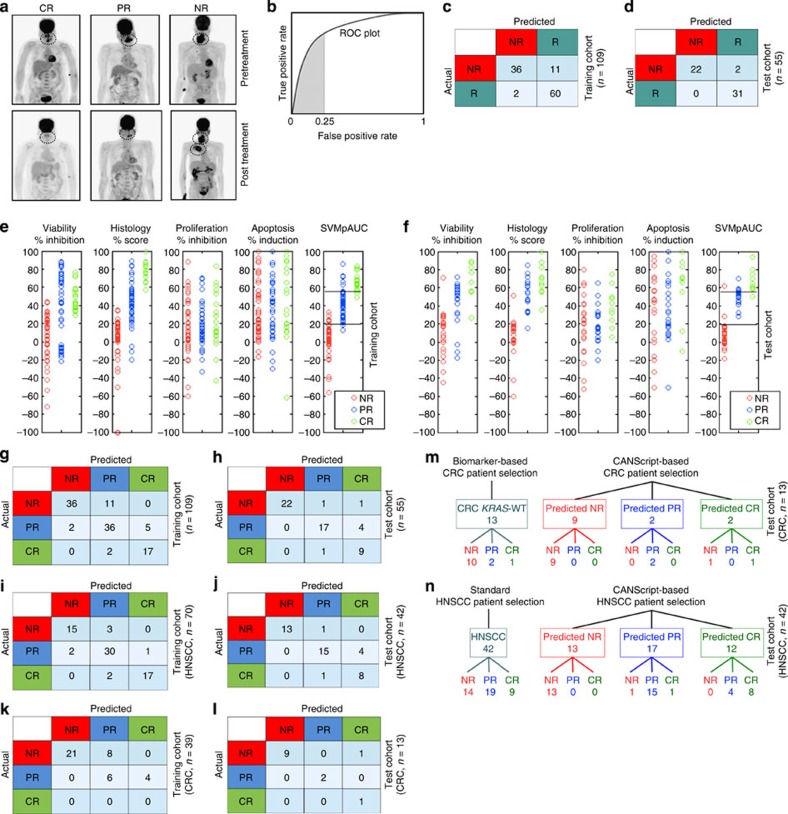
Figure 7. Validation of CANScript platform using clinical data.
(a) Positron emission tomography–computed tomography (PET–CT) for representative cases of CR (left), PR (middle) and NR (right) as determined by PERCIST. Primary treatment-naïve HNSCC patients underwent FDG–PET–CT scan examination before (predose) and after three cycles of TPF treatment (post dose). Clinical response to the drugs for individual patients was evaluated based on PERCIST data. (b) ROC plot showing true positive rate (sensitivity) and false positive rate (one minus specificity); the shaded area represents the partial area under the ROC curve up to false positive rate 0.25. The SVMpAUC algorithm used to learn a NR/R model to distinguish the non-responders from responders maximized the partial area under the ROC curve up to false positive rate of 0.25 on the training set. This encourages learning a model with high sensitivity, minimizing the number of potential responders (PR or CR patients) that are predicted to be NR while keeping specificity at least 75%. (c) Performance of learned NR/R model on the training set. Confusion matrix displays the number of patients with various actual and predicted responses to TPF for HNSCC and cetuximab+FOLFIRI for CRC in the training set (n=109). (d) Performance of learned NR/R model on the test set. Confusion matrix displays the number of patients with various actual and predicted responses in the test set (n=55). (e) Plots showing values of the functional read-outs from the CANScripts (that is, viability, histology, proliferation and apoptosis), as well as scores assigned by the SVMpAUC-learned model to patients in the training set, and (f) in the test set. (g) Performance of final refined NR/PR/CR prediction model on the training set. Confusion matrix displays the number of patients with various actual and predicted responses to TPF for HNSCC and cetuximab+FOLFIRI for CRC in the training set. (h) Performance of final refined NR/PR/CR prediction model on the test set. Confusion matrix displays the number of patients with various actual and predicted responses in the test set. (i,j,k and l) Performance of final refined NR/PR/CR prediction model on HNSCC cases alone in the training and test sets, and on CRC cases alone in the training and test sets, respectively.(m) CANScript-based model is a better tool than biomarker- (KRAS) based prediction of response to cetuximab and FOLFIRI in CRC. (n) CANScript-based model is a better tool than standard patient selection for response to TPF in HNSCC.

