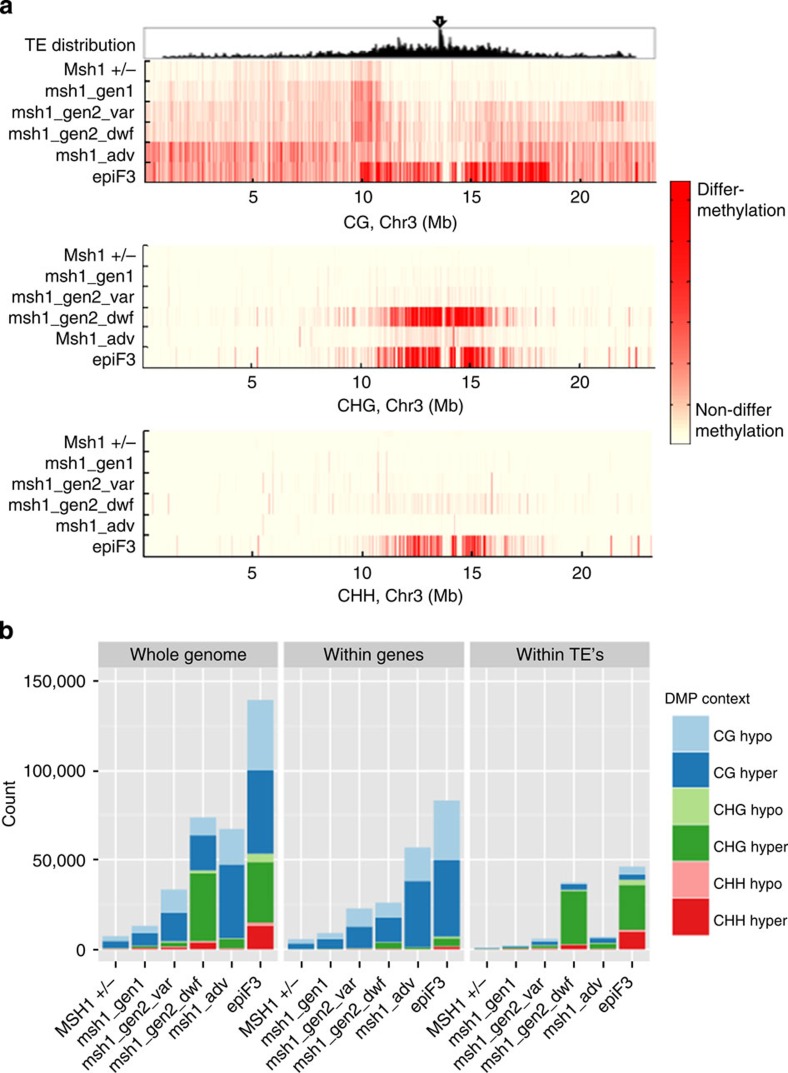
Figure 2. Pairwise DMP patterns of MSH1 +/− and early msh1 mutants when compared with wild-type segregants, and of chm1-1 (msh1 adv) and epiF3 when compared with stock Col-0.
(a) Distribution of CG, CHG and CHH-DMPs along chromosome 3. Top window, distribution of transposons; arrow indicates centromere. (b) Comparison of whole genome, gene and transposon pairwise DMP counts.

