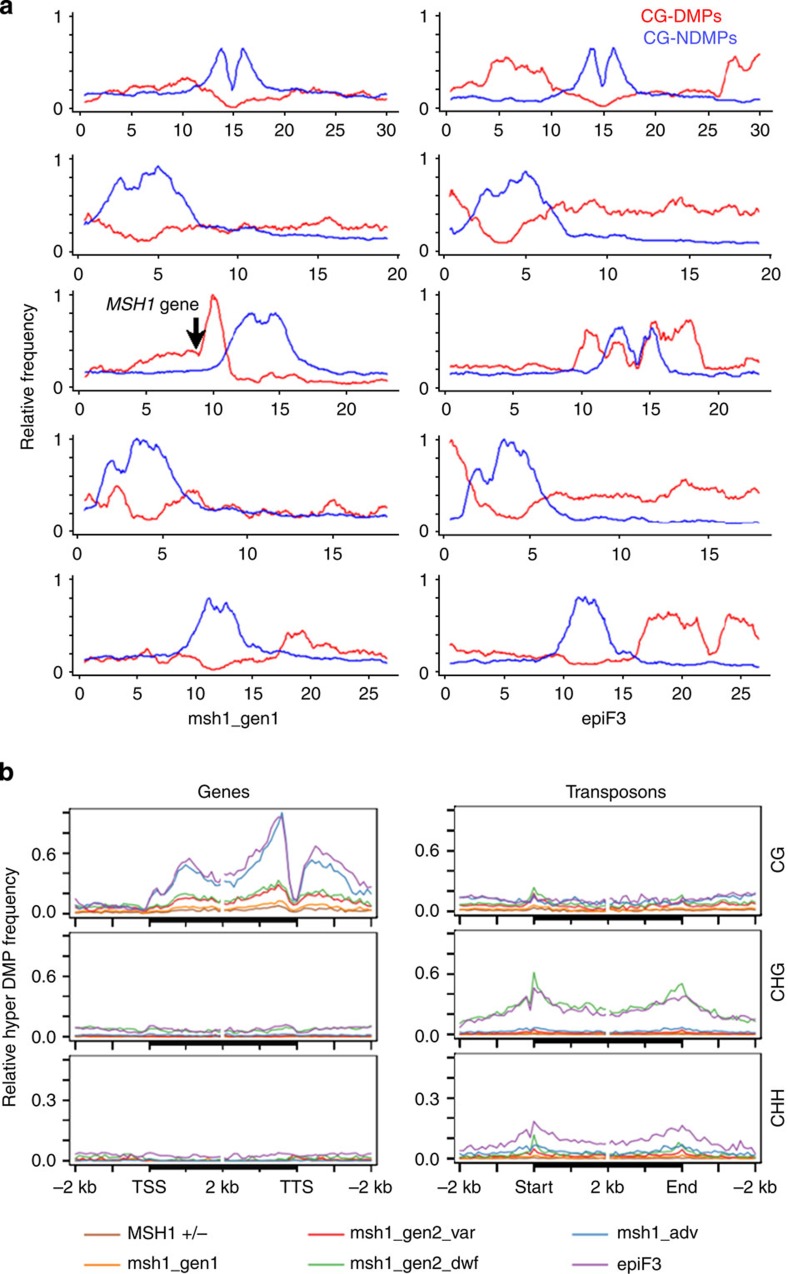
Figure 3. Unique patterning of DMPs in msh1 mutants and an enhanced growth epiF3 line.
(a) Chromosomal distributions of pairwise CG-DMPs (red) and CG-NDMPs (blue) in a comparison of first-generation msh1 to its segregating wild-type sibling (left), and epiF3 to stock Col-0 (all chromosomes normalized together in each comparison). Arrow indicates the position of the MSH1 gene on chromosome 3. (b) Distribution of hypermethylated pairwise DMPs over genes and transposons.

