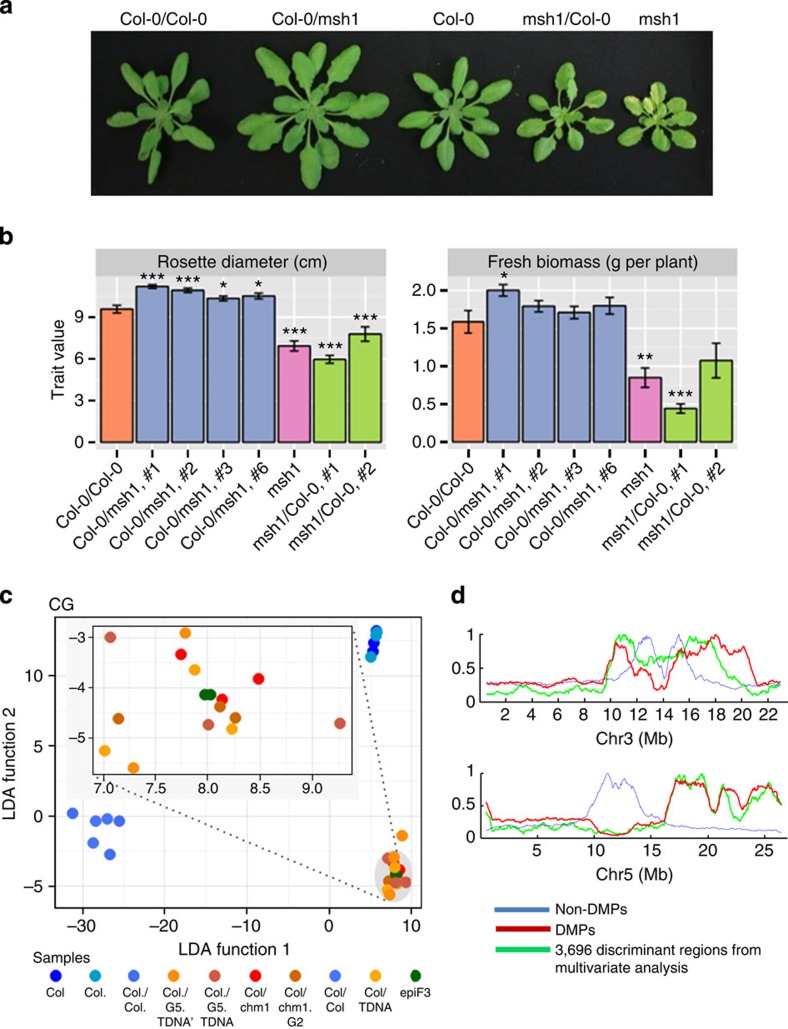
Figure 5. Graft transmission of the msh1-associated enhanced growth phenotype.
(a) Representative plants of the first generation of progeny from grafts, designated by scion/rootstock in each case. (b) Rosette diameter and fresh biomass of Col-0/Col-0 control graft compared with msh1 and the first generation of progeny from independent grafts involving Col-0 and msh1 advanced mutant chm1-1 (an average of 18 plants were measured; Welch’s t-test with *, ** and *** significant at 0.1, 0.05 and 0.001, respectively). (c) Three independent groups were detected by applying LDA: group 1, Col-0; group 2, Col-0/Col-0 and group 3, Col-0/chm1-1, Col-0/T-DNA and epiF3s. Pillai’s trace (1.9747) indicated highly significant statistical differences between group centroids (P<2.2 × 10⁻¹⁶). Analogous results were obtained for the pairwise comparisons group 1 versus group 3 (P<1.7 × 10⁻¹¹) and group 2 versus group 3 (P<2.2 × 10⁻¹⁶). The classification derived from LDA was independently corroborated by the consecutive application of PCA and support vector machine, which reached an accuracy of 99%. (d) Discriminating CG genomic regions (graft progeny from chm1-1 grafts and epiF3) overlapped with CG-DMPs for epiF3. Shown are chromosomes 3 and 5. All grafts involved floral stems and progeny measurements were taken at a single time point.

