
Figure 2.
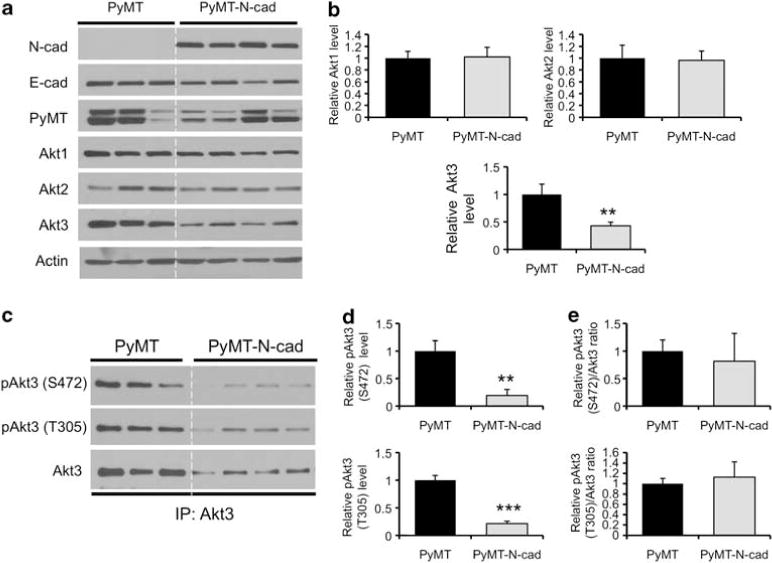
Akt3 expression and subsequently Akt3 phosphorylation are suppressed in PyMT-N-cadherin clonal cell lines compared with PyMT cell lines. (a) Levels of N-cad, E-cad, PyMT, Akt1, Akt2, Akt3, and actin were assessed by western blotting in clonal cells lines generated from PyMT and PyMT-N-cad primary tumors at 7 weeks post tumor onset. (b) The levels of each Akt isoform shown in (a) were quantified by densitometry and normalized to actin. (c) Akt3 was immunoprecipitated from the PyMT and PyMT-N-cad clonal cell lines using an Akt3 antibody and western blotted with antibodies against phosphorylated Akt (Ser473) or (Thr308) and Akt3. (d) The levels of Akt3 phosphorylation at Ser472 and Thr305 shown in (c) were quantified by densitometry. (e) The densitometry values of Akt3 phosphorylation at Ser472 and Thr305 were normalized to total Akt3 shown in (c). All bar graphs show the average densitometry values±s.e.m. from two independent experiments represented as fold change relative to PyMT cell lines. **P<0.01, ***P<0.001, two-tailed t-test.