Figure 2.

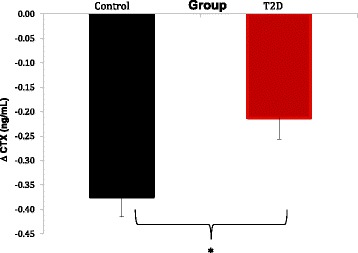
CTX suppression in response to the mixed meal. Variation between basal and nadir for controls (black) and T2D patients (red) are shown (mean and standard error). *Student’s t-test p-value = 0.006.

CTX suppression in response to the mixed meal. Variation between basal and nadir for controls (black) and T2D patients (red) are shown (mean and standard error). *Student’s t-test p-value = 0.006.