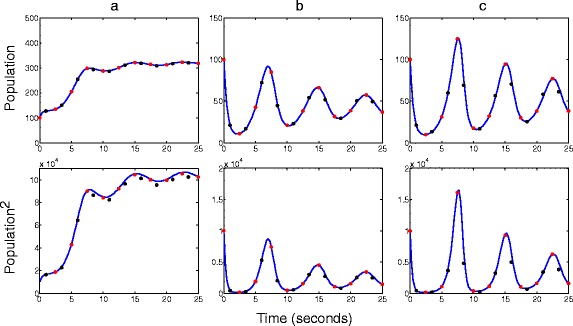
Figure 4.

A spatial predator prey system with a safe haven. First moments (top row) and second moments (bottom row) of the predator–prey system described in (9). Voxels (1,1), (3,3) and (5,5) are shown in subplots a, b and c, respectively. Parameters used are k 1 = 1[A]−1 s −1, k 2 = 0.02[A]−1[B]−1 s −1 k 3 = 0.25[A]−1 s −1, k 4 = 1[B]−1 s −1 k diff = 0.5[A]−1 s −1 for A and k diff = 0.5[B]−1 s −1. Initial conditions are 100 individuals of A and B in every voxel. Time steps for the SCLE and deterministic approaches were 0.001 seconds. RDME results are shown as blue lines. SCLE and deterministic results are shown as red and black dots, respectively.
