
Figure 1.
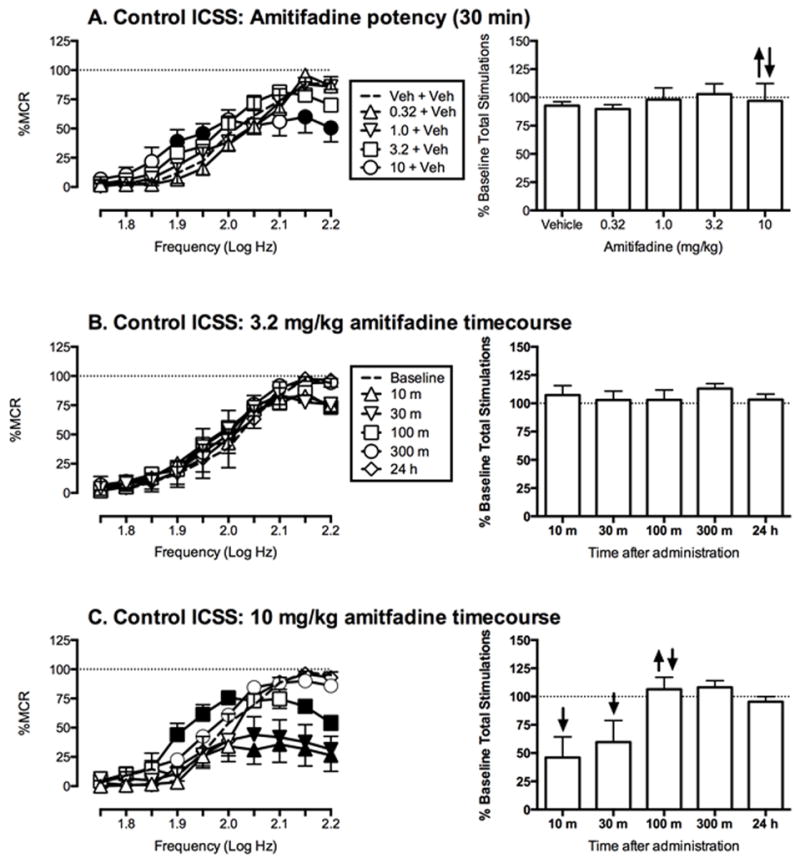
Effects of amitifadine on control ICSS in the absence of the noxious stimulus. Left column shows drug effects on full ICSS frequency–rate curves. Abscissae: Frequency of electrical brain stimulation in Log Hz. Ordinates: Percent maximum control reinforcement rate (%MCR). Filled points represent frequencies at which reinforcement rates were statistically different from vehicle rates as determined by a two-way ANOVA followed by a Holm–Sidak post hoc test, P < 0.05. Right column shows summary ICSS data expressed as percent pre-drug baseline number of stimulations per component delivered across all frequencies of brain stimulation. Abscissae: drug dose in mg/kg. Ordinates: Percent baseline total number of stimulations per component. Upward/downward arrows indicate significant drug-induced increase/decrease in ICSS relative to vehicle for at least one brain stimulation frequency as determined by analysis of full frequency–rate curves. All data show mean ± SEM for five to six rats. Statistical results for data in left panels are as follows: (A) Amitifadine potency at a 30 min pretreatment time (N=5): significant main effect of frequency [F(9,36) = 27.9, P < 0.001], no significant main effect of dose [F(4,16) = 0.7, P = 0.59], and a significant frequency X dose interaction [F(36,144) = 2.7, P = < 0.0001]. (B) 3.2 mg/kg amitifadine timecourse (n = 6): significant main effect of frequency [F(9,45) = 32.1, P < 0.0001] but not of time [F(5,25) = 0.7, P = 0.61], and no significant interaction [F(45,225) = 1.4, P = 0.05] (C) 10 mg/kg amitifadine timecourse (n = 6): significant main effect of frequency [F(9,45) = 36.6, P < 0.0001], time [F(5,25) = 4.8, P < 0.003] and significant frequency X time interaction [F(45,225) = 5.8, P < 0.0001].