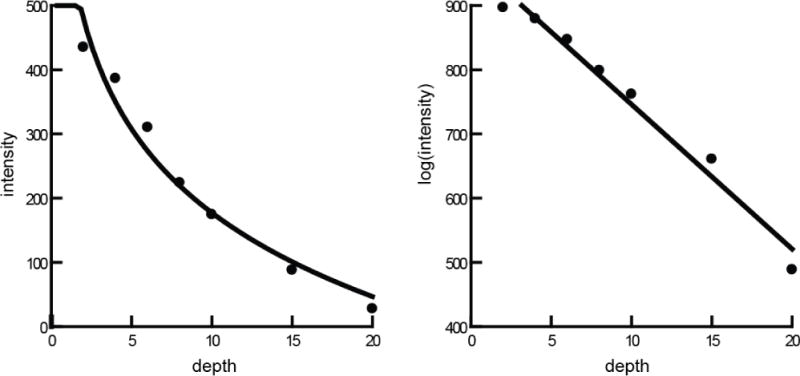
Figure 4.

The depth-intensity curve of the phantom data. The left curve line was based on original image data and the right linear line was based on log image data, calculated by ImageJ. The seven points are from the data of the tubes filled with barium milk with different depth ranging from 2mm to 20mm. The scale is abritary units of intensity and volume. R2 > 0.97 for both models.
