
Figure 3. PI3KC2β-depletion results in reduced tumor growth in vivo.
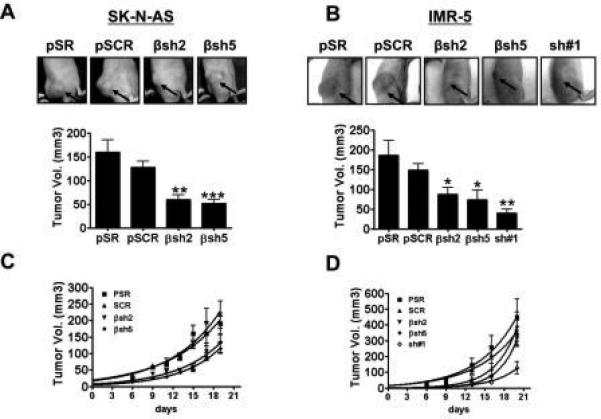
Xenograft assays. SK-N-AS (A) or IMR-5 (B) cells were injected into nude mice (eight injections per condition). Shown are tumors that formed in mice at 15 days post injection. Graphs below pictures represent the average tumor volume +/− standard error at day 10 post-injection. A two-tailed Student's T test was applied to determine significance compared to pSCR. For IMR-5 βsh2 has p=0.02* and βsh5 p=0.016*; sh#1 has p=0.0038**; for SK-N-AS βsh2 has p=0.002** and βsh5 p=0.0005***. Differences between pSR and pSCR were not significant. Tumor growth for SK-N-AS cells (C) and IMR-5 cells (D) were monitored for the indicated times.