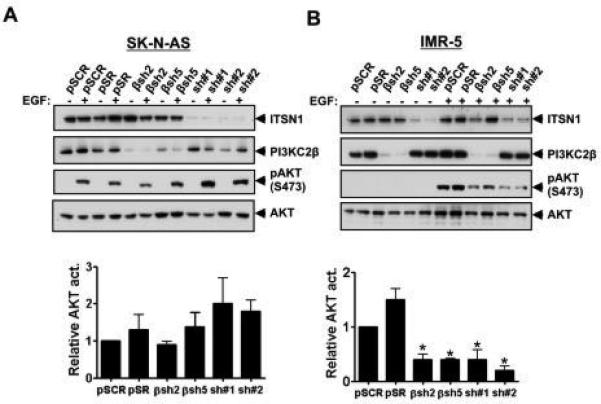
Figure 4. Silencing PI3KC2β or ITSN1 results in reduced AKT activation in IMR-5 cells.

SK-N-AS (A) and IMR-5 (B) cells stably infected with virus expressing control (pSCR or pSR), ITSN1 (sh#1 or sh#2), or PI3KC2β (βsh2 or βsh5) shRNAs and grown in complete media containing 10% serum, then stimulated with or with EGF (100 ng/ml for 10 min), lysed and analyzed by Western blot to assess phosphorylation of AKT at Ser473 as well as total AKT levels. Levels of ITSN1 and PI3KC2β are also shown. Relative AKT phosphorylation was calculated by comparing the level of AKT phosphorylation in samples in the presence of EGF and normalizing to AKT phosphorylation levels in pSCR stimulated with EGF. Graphs are the average +/− standard error of three independent experiments. For IMR-5 βsh2, βsh5, sh#1 and sh#2, p<0.05 compared to control pSCR. For SK-N-AS, differences in phosphorylation between samples were not significant.
