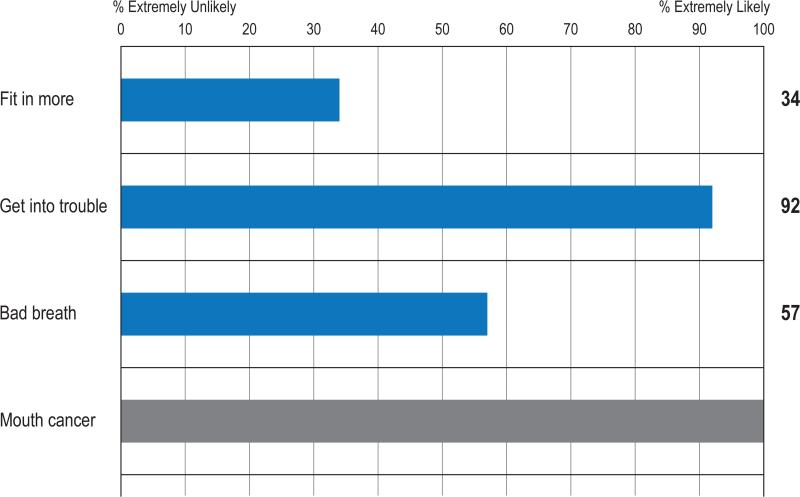
Figure 1. Example Questionnaire Item with Horizontal Sliding Bars.
Participants were randomly assigned, with equal probability, to either blank spaces or sliding bars (depicted above) to indicate their perceived probability, from 0% to 100%, that specific outcomes would happen to them, under the hypothetical condition that they had just began using cigarettes or electronic cigarettes. The sliding bar was manipulated by touching the screen on tablet computers running survey software (Qualtrics, www.qualtrics.com). The figure above shows the first 4 of a list of specific outcome items. In the figure, the blue bars have been manipulated to indicate a response, while the gray bar has not yet been moved. All participants were shown the same outcome items but in individually randomized order.

